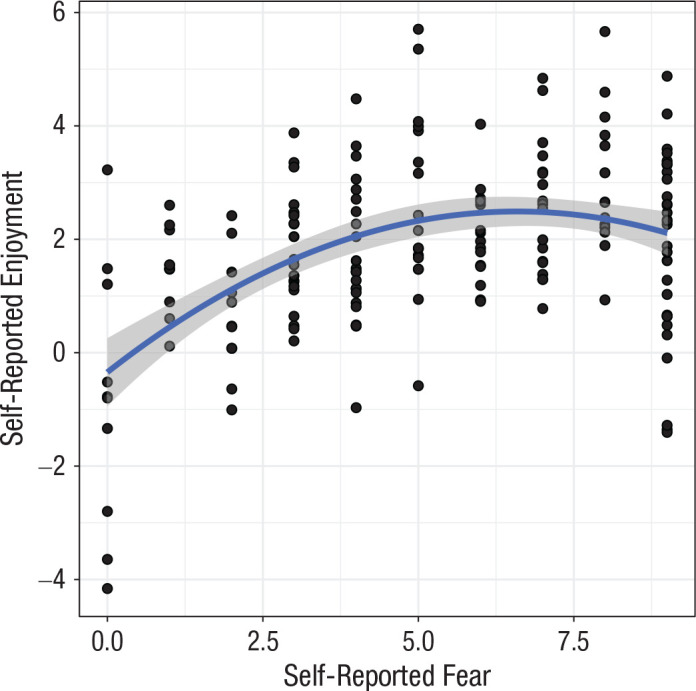
Fig. 4.

Scatterplot showing the relation between site-specific self-reported enjoyment and site-specific self-reported fear, after the effects of fixed and random factors are removed. The blue line shows the best-fitting regression, and the gray band is the 95% confidence interval.
