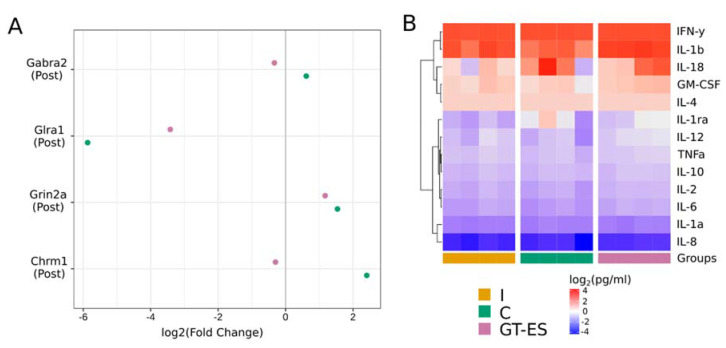
Figure 8.
Cytokines profiling and synaptic gene expression in the spinal cord at 60 days after SCI. (A) Comparison of target genes expression. The results are represented as an average log2(fold change) in control (C, green points) and treated (GT-ES, pink points) pigs relative to the expression level in the intact group. Threshold cycles (Ct) were obtained for two animals (two repeats per animal) in each group and normalized by corresponding Gapdh values. (B) Heatmap representing a log-transformed cytokines absolute concentration in spinal cord samples, where each column represents tissue samples (two samples per animal). Columns are bunched by experimental groups (I, C, and GT-ES). Cytokines are ordered by the results of hierarchical agglomerative clustering.

