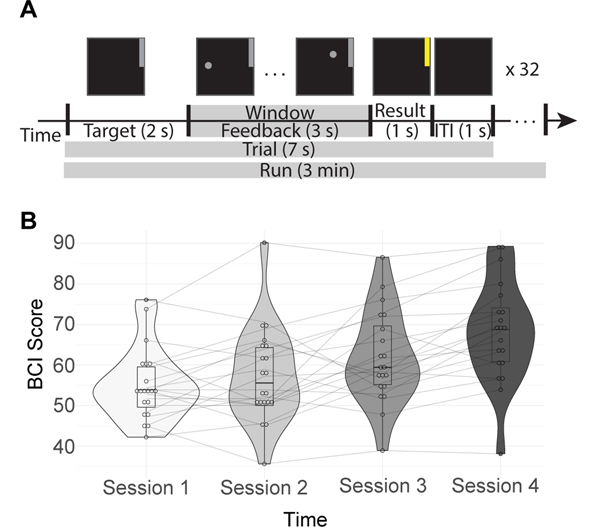
FIG. 2. BCI task and performance.
(A) Schematic of the BCI task. First the target, a grey bar in the upper or lower portion of the screen, was displayed for 1 s. Next, the subjects have a 3 s feedback period, where the vertical position of the cursor is determined by their neural activity while it moves horizontally at a fixed velocity. This portion corresponds to the analysis window, indicated with a grey bar in the figure. The result is then displayed for 1 s. If the subject reached the target, it will turn yellow; otherwise it will remain grey. There is a 1 s intertrial interval (ITI) between trials where nothing is displayed on the screen. This sequence is repeated 32 times per run, with 6 runs per session. (B) Each subject’s average performance across four days within two weeks. BCI Score is the percentage of correct trials during that session.

