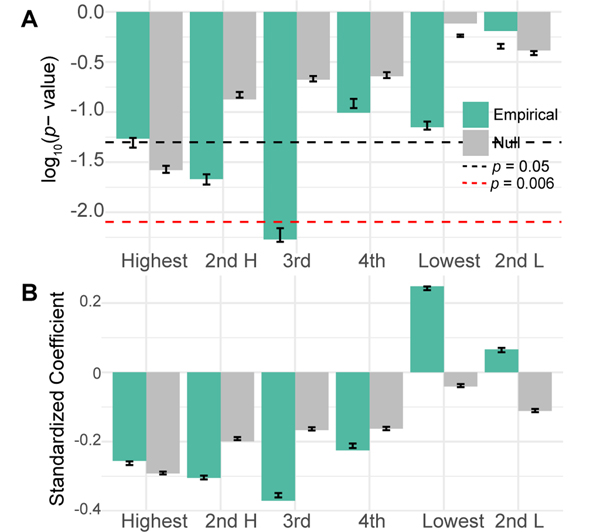
FIG. 3. Performance loading is associated with learning.
(A) Here we show the p-values for empirical (green) and uniformly phase randomized (grey) data for linear models relating the slope of performance with ranked performance loading from each frequency band. The black line corresponds to p = 0.05, while the red dashed line corresponds to the Bonferroni corrected α = 0.008. Error bars show the standard error and median of p-values from 500 models with bootstrapped samples. (B) The standardized regression coefficients for the same models. Error bars show the standard error and mean of coefficients from 500 models with bootstrapped samples.

