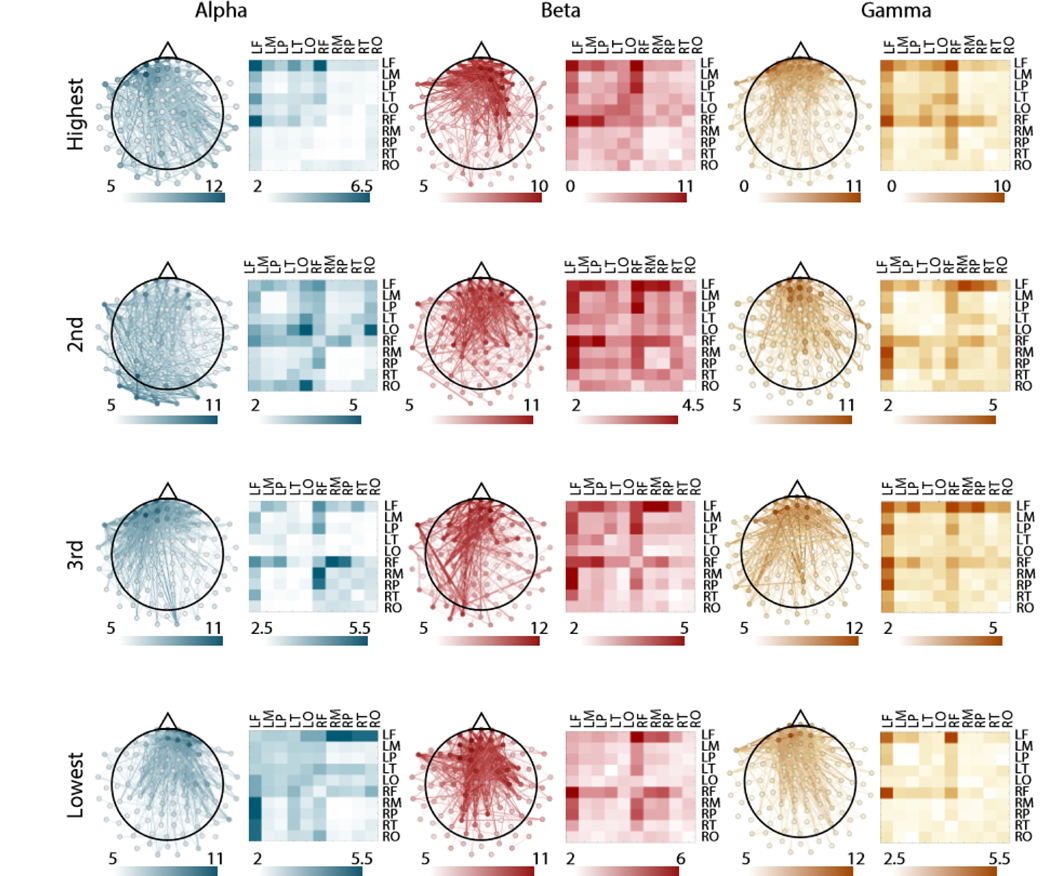
FIG. 4. Spatial distribution of subgraph edges that are consistent across participants.
Consistent edges for each frequency band and for each ranked subgraph. Left images show individual edges plotted on a topographical map of the brain. Right images show the mean edge weight over sensors for a given region. We studied 10 regions, including the frontal lobe, temporal lobe, parietal lobe, occipital lobe, and motor cortex in both hemispheres. The weight of the edge corresponds to the number of individual participants for whom the edge was among the 25% strongest for that subgraph.

