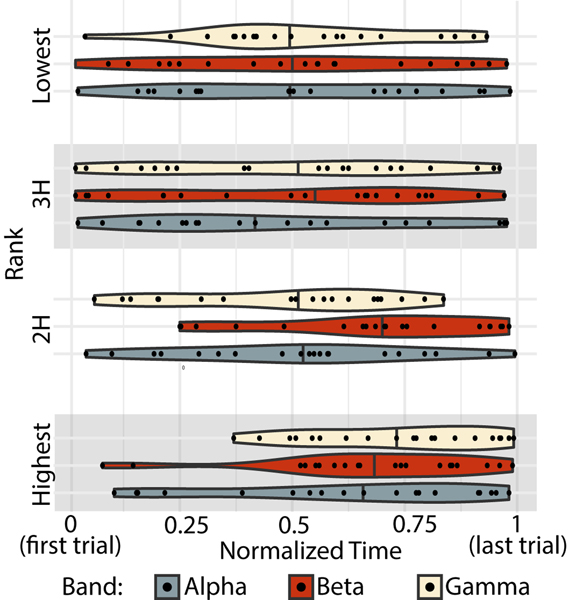
FIG. 5. Temporal expression of ranked subgraphs.
The peak temporal expression for every subject (black data point), for each frequency band (indicated by color) and for each subgraph (ordered vertically). Violin plots show the density distribution of all subjects’ peaks. The median is marked with a solid line through the violin plot.

