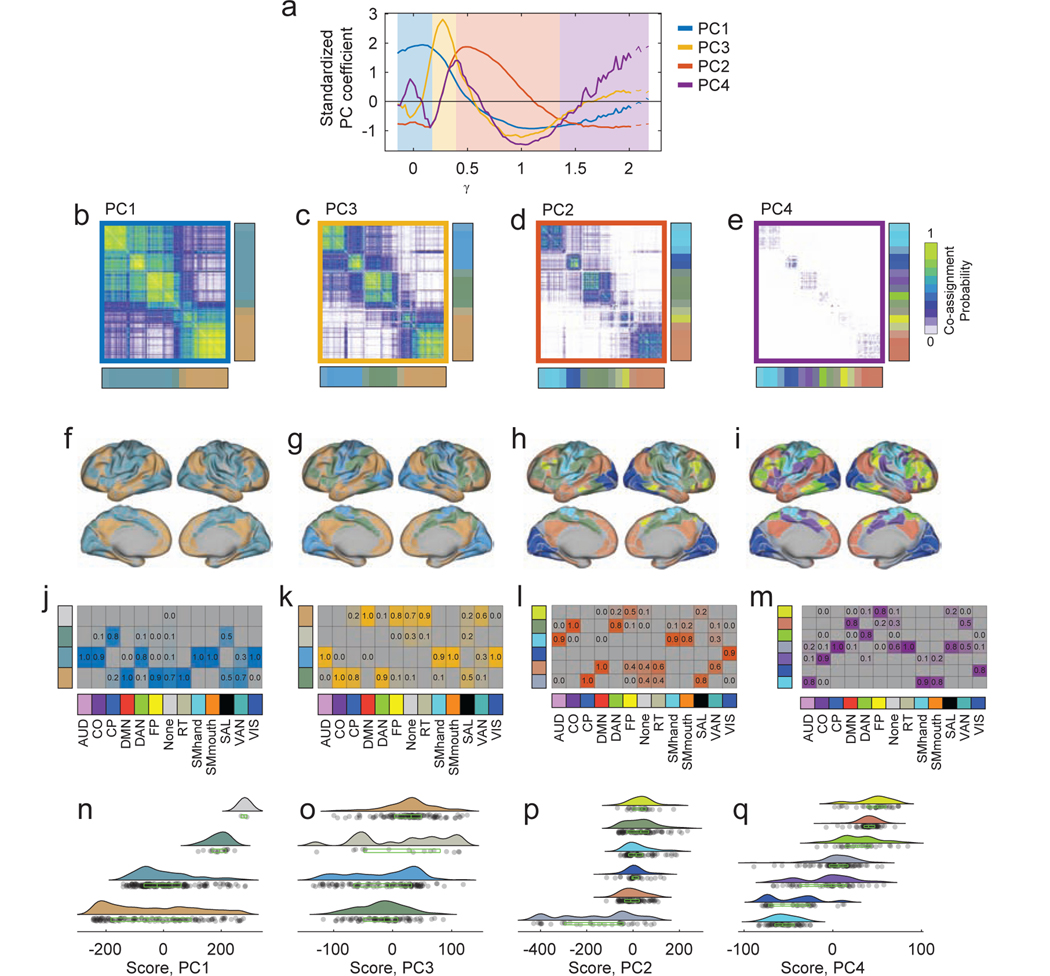
FIG. 5. Community structure changes as a function of γ.
We restricted our analysis to the region of parameter space with ω < 10−2. Within this space, virtually all variation in community structure occurs as a function of γ. We then calculated the average PC coefficient for each of the four PCs as a function of γ and z-scored these values for each PC independently. (a) This procedure enabled us to partition γ values into four segments according to which PC is dominant at that point in parameter space. (b-e) For each segment, which corresponded to a different PC’s dominance, we calculated the co-assignment probability for all pairs of nodes. (f - i) We also derived each segments’ consensus communities. (j-m) We also assessed how brain systems described in [26] are distributed across detected communities. In these panels, each column corresponds to one of the thirteen systems and each row corresponds to a detected community. Columns were normalized so that they sum to unity. Within a column the values of cells indicate the fraction of that system’s regions that were assigned to each of the detected communities. (n-q) We break down the PC scores by detected communities.

