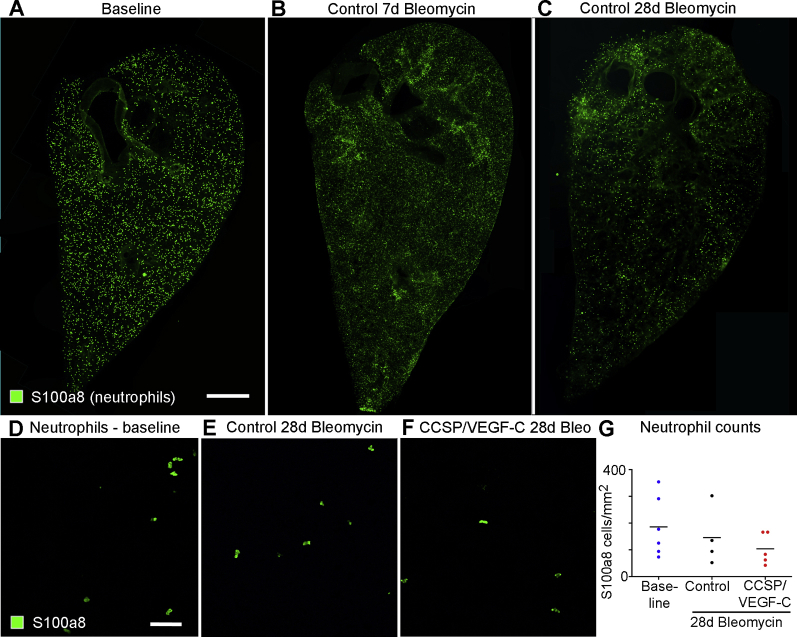
Supplemental Figure S10.
No relationship of distribution or numbers of lung neutrophils to lymphatics and fibrosis. A–C: Neutrophils were widely scattered throughout the lung, with no obvious difference in distribution after bleomycin challenge. D–G: No significant differences were found in the numbers of neutrophils in baseline lungs or after bleomycin treatment for the same regions as shown in Figure 6, K–M. G: Counts of neutrophils. Dots indicate individual mice. Blue dots represent baseline (no bleomycin); black dots, control mouse with normal lymphatics 28 days after bleomycin; red dots, CCSP/vascular endothelial growth factor C mouse with extra lung lymphatics 28 days after bleomycin administration. n = 4 to 6 per group (G). Scale bars: 1 mm (A–C); 50 μm (D–G).

