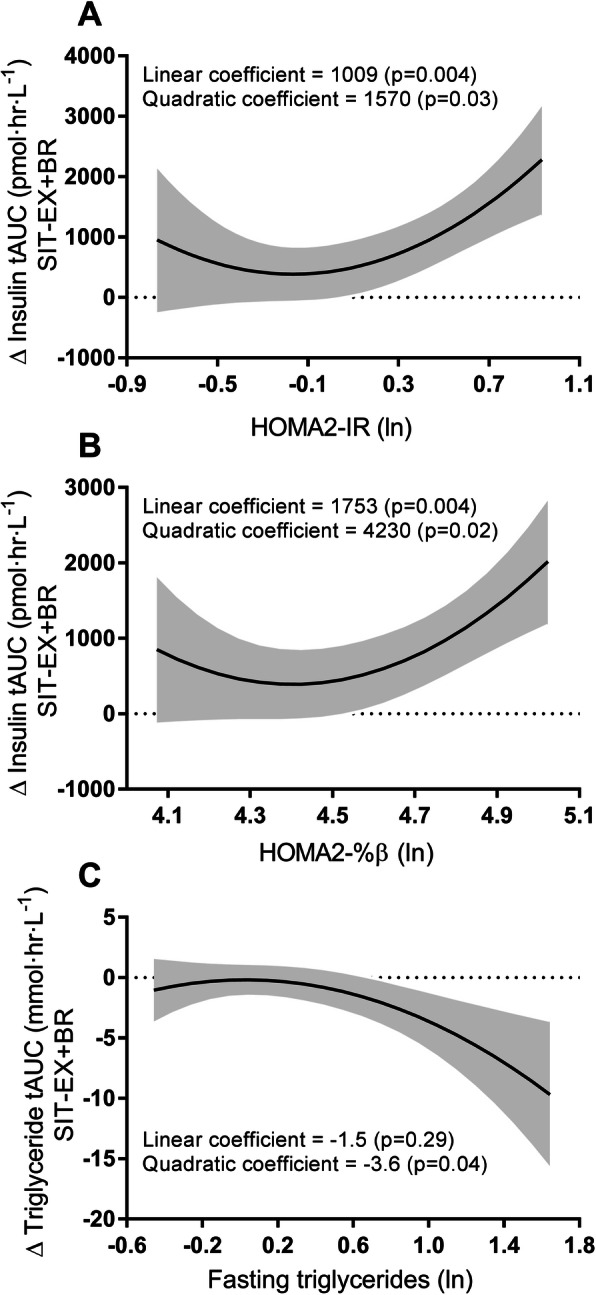
Fig. 5.

Associations between intervention-induced change and fasting baseline variables. Panels A-C represent the curvilinear relationships between intervention-induced change in insulin tAUC and HOMA2-IR, insulin tAUC and HOMA2-%β, triglyceride tAUC and fasting triglycerides, respectively. Fasting baseline variables were taken as the average across three conditions. The curved black line represents the line of best fit, calculated from a mixed model controlling for age, sex, waist circumference, change in plasma volume, testing site and treatment order. The shaded area represents the 95% confidence bands; ln indicates natural logarithm
