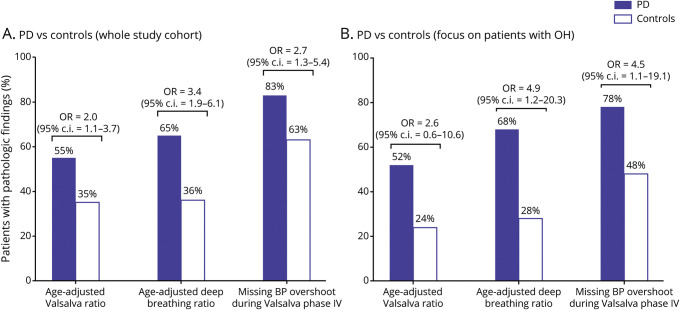
Figure 3. Cardiovascular autonomic function tests in patients with Parkinson disease (PD) vs controls.
Frequency of pathologic cardiovascular autonomic function indices in the overall PD and control population (A) and in the transient orthostatic hypotension (OH)–positive PD vs control cases (B). Odds ratios (ORs) were calculated after adjusting for potential confounding factors highlighted by the univariate analysis reported in table 1. BP = blood pressure; CI = confidence interval.

