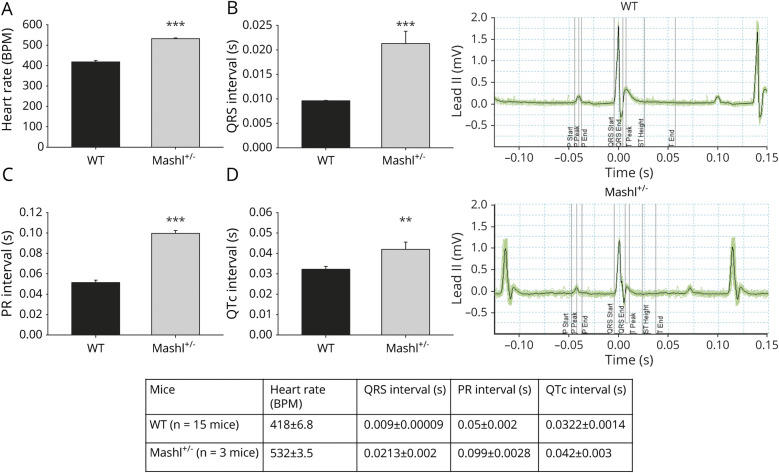
Figure 5. ECG data in the Mashl+/− compared to WT mice.
Comparison of ECG data acquired from wild-type (WT; n = 15) and Mashl+/− mice (n = 3). (A) Heart rate, (B) QRS interval, (C) PR interval, and (D) QTc interval. Traces are examples of ECG traces in WT and mutant mice. Heart rate, QRS, and PR interval were higher in Mashl+/− mice. ***p ≤ 0.001, **p < 0.01 (Student t test). BPM = beats per minute.

