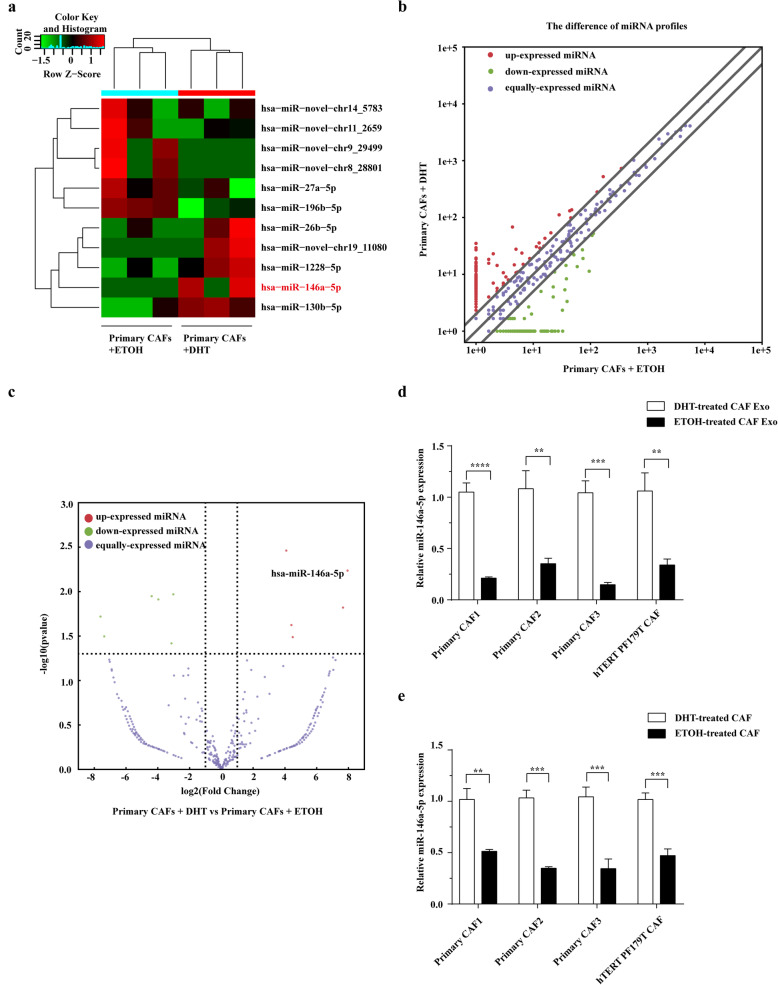
Fig. 4.
The level of miR-146a-5p significantly decreased in the exosomes isolated from CAFs after ADT. a Heatmap of the significantly differential miRNAs between ETOH-treated and matched DHT-treated CAFs-derived exosomes. Red, green, and black indicated miRNAs with higher, lower, and equal expression, respectively. b The scatter plot represents the differential miRNA expression profiles between ETOH-treated and DHT-treated CAFs-derived exosomes. Red, green, and purple indicated miRNAs with higher, lower, and equal expression, respectively. c Volcano plot presents differential expression of miRNAs between ETOH-treated and matched DHT-treated CAFs-derived exosomes. Red, green, and purple indicated miRNAs with higher, lower, and equal expression, respectively. d Real-time PCR analysis of miR-146a-5p expression in exosomes from DHT-treated CAFs and matched ETOH-treated CAFs (n = 4). e Real-time PCR analysis showing the expression of miR-146a-5p in DHT-treated CAFs and matched ETOH-treated CAFs (n = 4). Data are shown as mean ± SD representing triplicate measurements. (Student’s t-test, **P < .01, ***P < .001, ****P < .0001)

