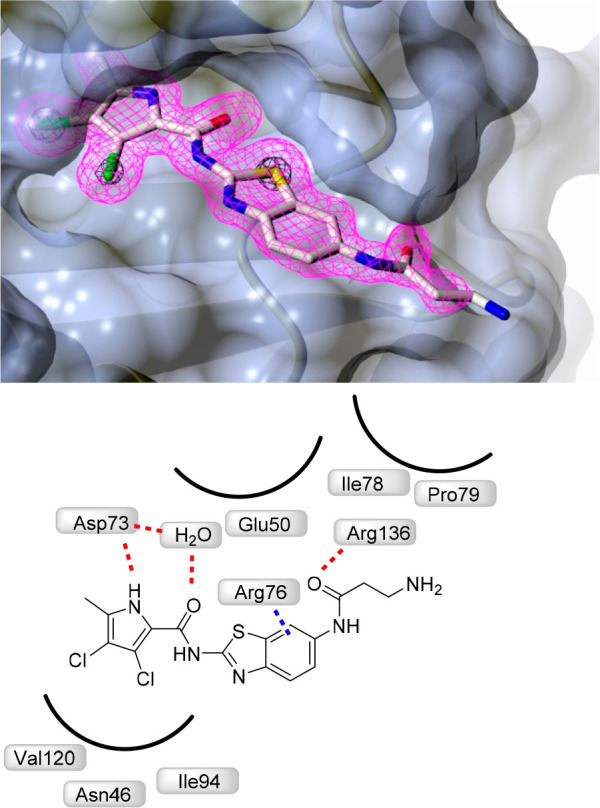
Figure 2.

Crystal structure of the complex formed between 16a and E. coli GyrB 24 kDa fragment (PDB: 6YD9). The protein is depicted in cartoon representation covered by a semitransparent molecular surface. Omit mFobs-DFcalc positive difference electron density for the ligand at 1.6 Å resolution is depicted at two contour levels: 3σ (magenta mesh) and 12σ (black mesh), with the latter highlighting the locations of the electron-dense chlorine and sulfur atoms. Shown below are the interactions between amino acid residues with ligand (red line: hydrogen bond, blue line: π–cation interactions).
