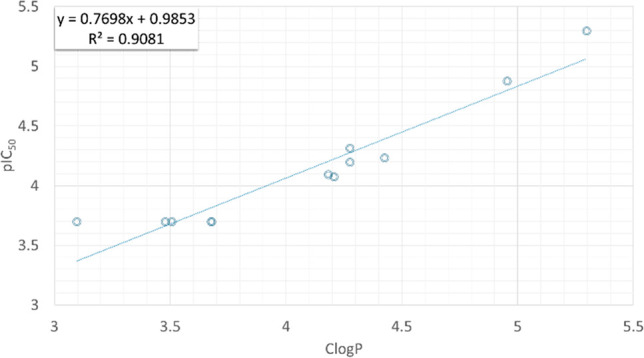
Figure 3.

Correlation between cytotoxicity in HepG2 cells and lipophilicity as expressed from their pIC50 and clogP plot after the removal of two outliers (n = 12). Predicted clogP (a) was generated with OSIRIS Datawarrior version 5.0.0 © 2002–2019 Idorsia Pharmaceuticals Ltd.
