Fig. 4.
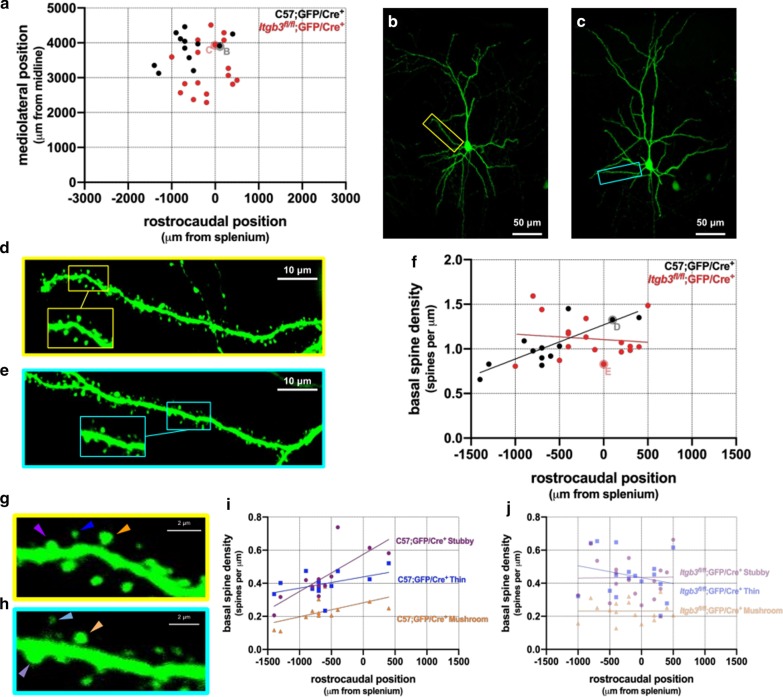
In contrast to Itgb3fl/fl;GFP/Cre+ neurons, rostrocaudal positions of C57;GFP/Cre+ layer II/III neurons are correlated with basal dendritic spine density. a Cortical (x,y) positions of C57;GFP/Cre+ neurons (black) and Itgb3fl/fl;GFP/Cre+ neurons (red). b Medium magnification (× 20) maximum intensity Z-projection of C57;GFP/Cre+ neuron (black dot labeled “B” in panel a). c As in (b), this time of a Itgb3fl/fl;GFP/Cre+ neuron (red dot labeled “C” in panel a). d High magnification (× 60) maximum intensity Z-projection of a basal dendrite (yellow inset in panel b). e As in (d), of cyan inset in panel c. f In C57;GFP/Cre+ neurons, basal dendritic spine density is strongly correlated with rostrocaudal position (R2 = 0.74, p < 0.006), but not in Itgb3fl/fl;GFP/Cre+ neurons (R2 = 0.013, p = 0.66). g Magnified view of inset in panel d, showing the three main dendritic spine types: mushroom (red arrowhead), thin (blue arrowhead), and stubby (orange arrowhead). h As in (g), of inset in panel e: mushroom (light red arrowhead), thin (light blue arrowhead), and stubby (light orange arrowhead). i Basal dendritic spine type density by rostrocaudal position in C57;GFP/Cre+ neurons. R2 = 0.65, p < 0.003 (stubby), R2 = 0.45, p = 0.13 (thin), R2 = 0.76, p = 0.05 (mushroom); j Rostrocaudal position of Itgb3fl/fl;GFP/Cre+ neurons is not correlated with dendritic spine density of any spine type. R2 < 0.001, p = 0.95 (stubby), R2 < 0.06, p = 0.36 (thin), R2 < 0.00001, p = 0.99 (mushroom). C57;GFP/Cre+ N = 12 neurons; Itgb3fl/fl;GFP/Cre+ N = 17 neurons

