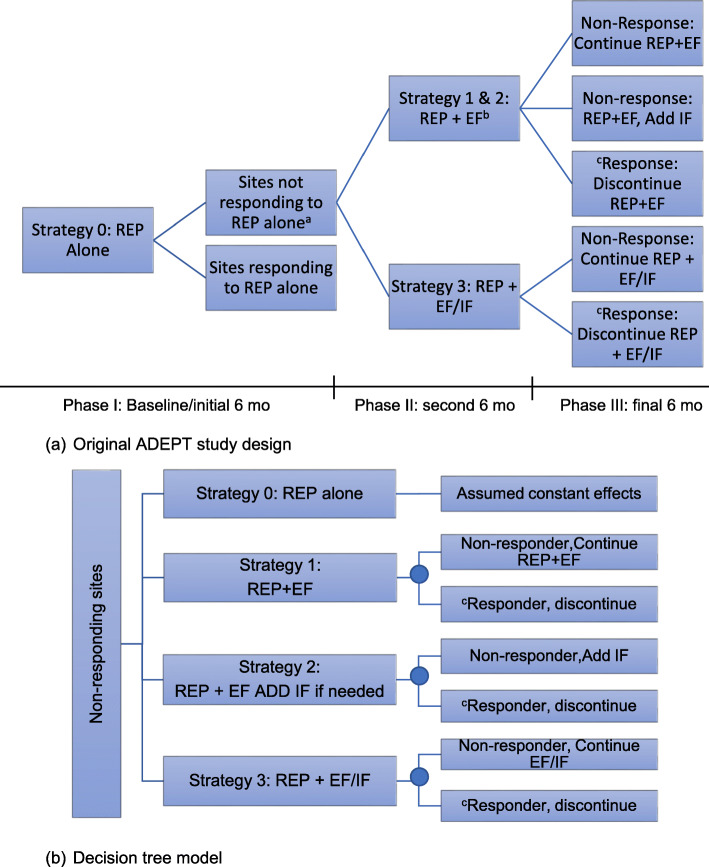
Fig. 4.
The original study design to evaluate effectiveness (a) and decision tree model to evaluate cost-effectiveness (b). This cost-effectiveness analysis focuses on implementation strategies for sites not responding to the REP alone intervention (the “sites not responding to REP alone” portion of the tree in 2a). In the original study, baseline data were gathered prior to initiation of the trial phase (Phase I). In this study, we sought to determine the most cost-effective option for deploying an implementation strategy with multiple components across its all possible permutations (e.g., REP+EF/IF) and comparing this to usual implementation (baseline REP). To accomplish this, we created the decision tree to represent all the decision options and their subsequent steps and estimate their respective costs and consequences to allow for comparison. This modeling approach represents the possible implementation strategy decision options for decision makers, quantifies the uncertainty, and allows for evaluation of alternatives. a In the original trial, non-responding sites were randomized following Phase I to REP+EF or REP+EF/IF. b Following Phase II, non-responding sites in the REP+EF condition were randomized again to either continue REP+EF or add IF (REP+EF/IF). Details of the trial are published elsewhere (see Kilbourne et. al., 2014). c Sites that responded to the implementation strategy after the initial 6 months of the Trial Phase: either < 10 patients receiving Life Goals or > 50% of patients receiving Life Goals had ≤ 3 sessions, min dose for clinically significant results. Sites that responded to the implementation strategy discontinued the strategy during the second 6 months/Phase III of the trial

