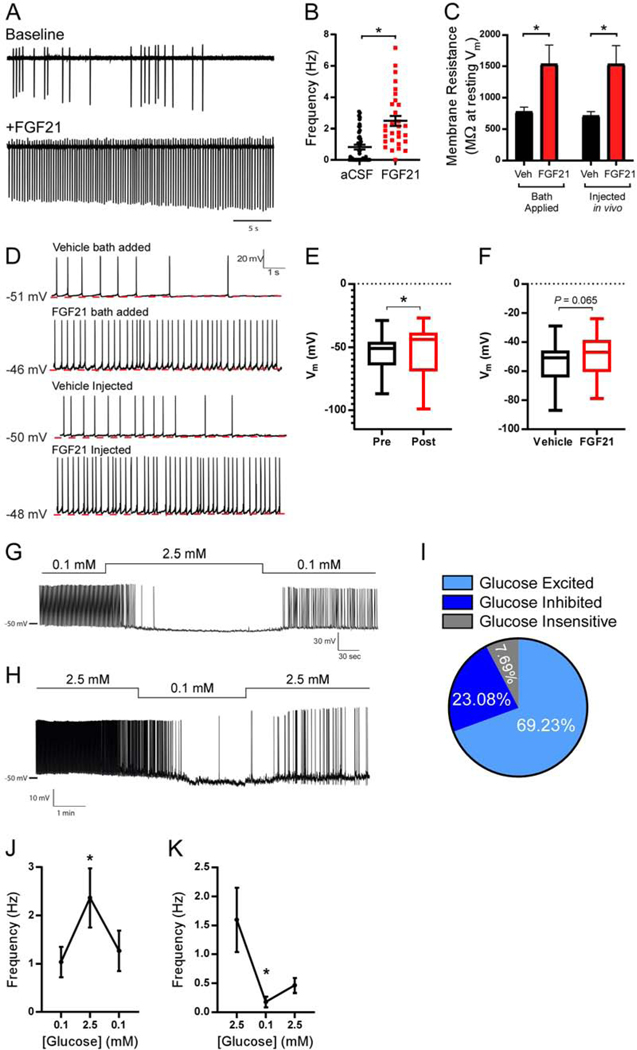
Figure 5. FGF21 increases excitability and activity of KLB-expressing neurons in the VMH.
(A) Representative traces of action current firing using cell-attached recordings in KLB+ VMH neurons in acute brain slices at baseline (top trace) and following FGF21 application (bottom trace, 50 ng/ul).
(B) Average firing frequency at baseline (aCSF) and following FGF21 application in KLB+ VMH neurons in acute brain slices (n = 45 neurons/3 mice for aCSF, n = 30 neurons/3 mice for FGF21). Mean +/− SEM plotted, unpaired two-tailed Student’s t-test.
(C) The average membrane resistance plotted in KLB+ VMH neurons in slices receiving bath application of FGF21 (50 ng/ul, n = 24 neurons/3 mice) or vehicle (n = 30 neurons/3 mice) and in vivo administration of FGF21 (1 mg/kg, i.p., n = 13 neurons/3 mice) or vehicle (n = 15 neurons/3 mice), 2-way ANOVA w/ Sidak’s multiple comparison test.
(D) Average resting membrane potential and traces of whole cell current clamp recordings in KLB+ VMH neurons in vehicle injected (n = 53 neurons/4 mice), FGF21 bath added (50 ng/ul, n = 37 neurons/4 mice), and FGF21 injected mice (1 mg/kg, i.p., n = 37 neurons/4 mice).
(E and F) Membrane potential measured in (E) KLB+ neurons in the VMH in slices before (pre) and following application of FGF21 in bath (post) or (F) KLB+ neurons in the VMH in slices from mice administered vehicle or FGF21 by i.p. injection as described in C. Kolmogorov-Smirnov test was used when comparing pre- and post-FGF21 bath application while an unpaired two-tailed Student’s t-test was used to compare between vehicle and FGF21 i.p. injected mice.
(G) Representative trace of a whole-cell current clamp recording in a glucose inhibited KLB+ VMH neuron in response to the indicated glucose concentrations.
(H) Representative trace of a whole cell current clamp recording in a glucose excited KLB+ VMH neuron in response to the indicated glucose concentrations.
(I) Pie chart illustrating the percentage of KLB+ VMH neurons which are glucose-excited, glucose-inhibited, and glucose insensitive in (n = 26 neurons/3 mice).
(J-K) Average action potential frequency in KLB+ VMH glucose excited neurons in response to indicated glucose concentrations (n = 7 neurons for (J) and 7 neurons for (K) from 4 mice each).
Values are mean +/− SEM. (*, P < 0.05). Comparisons were made using a paired two-tailed Student’s t-test.

