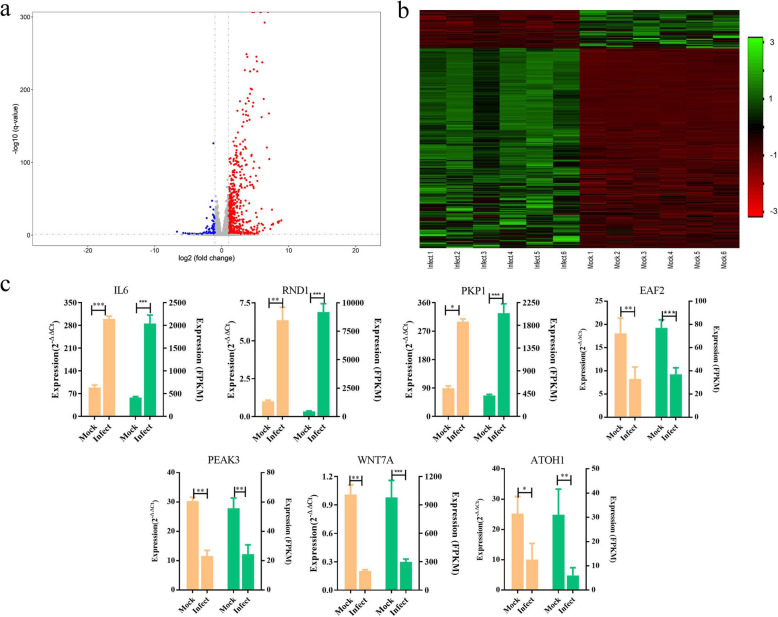
Fig. 3.
Identification of differentially expressed genes. a Volcano plots of differentially expressed genes between the mock-infected and PEDV-infected groups. The red and green dots represent upregulated and downregulated genes, respectively, in the PEDV-infected group compared with the mock-infected group. b Heatmap showing the expression levels of the differentially expressed genes. Columns represent individual samples and rows indicate genes with significant expression differences between the two groups. c qRT-PCR validation of the differentially expressed genes. The left axis represents gene expression levels as determined by qRT-PCR, and the right axis represents the expression levels determined by RNA-seq in FPKM units. mRNA expression levels were normalized to the mRNA levels of the pig ACTB gene. Graphed data represent the mean ± SD, n = 6. * represents p < 0.05, ** represents p < 0.01, *** represents p < 0.001

