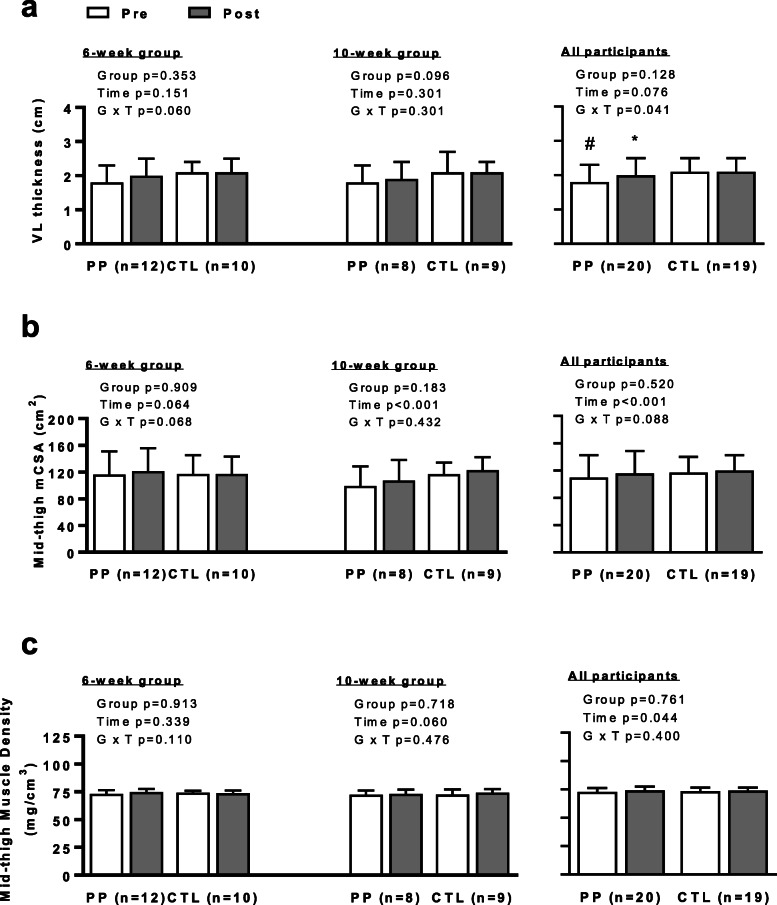
Fig. 6.
Changes in Mid-thigh Muscle Hypertrophy Measurements. Legend: Data in this figure indicate that vastus lateralis (VL) muscle thickness increased in PP participants when the 6- and 10-week cohorts were pooled, whereas this did not occur in CTL participants (panel a). However, a significant interaction was not observed in pQCT-derived mid-thigh lean muscle cross sectional area values (panel b) or mid-thigh pQCT-derived muscle density (panel c). All data are presented as mean ± standard deviation values. Abbreviations: PP, peanut powder supplemented participants; CTL, non-supplemented participants. Symbols: *, significant increase within PP from Pre to Post (p < 0.05); #, PP < CTL at Pre (p < 0.05)

