
Figure 1.
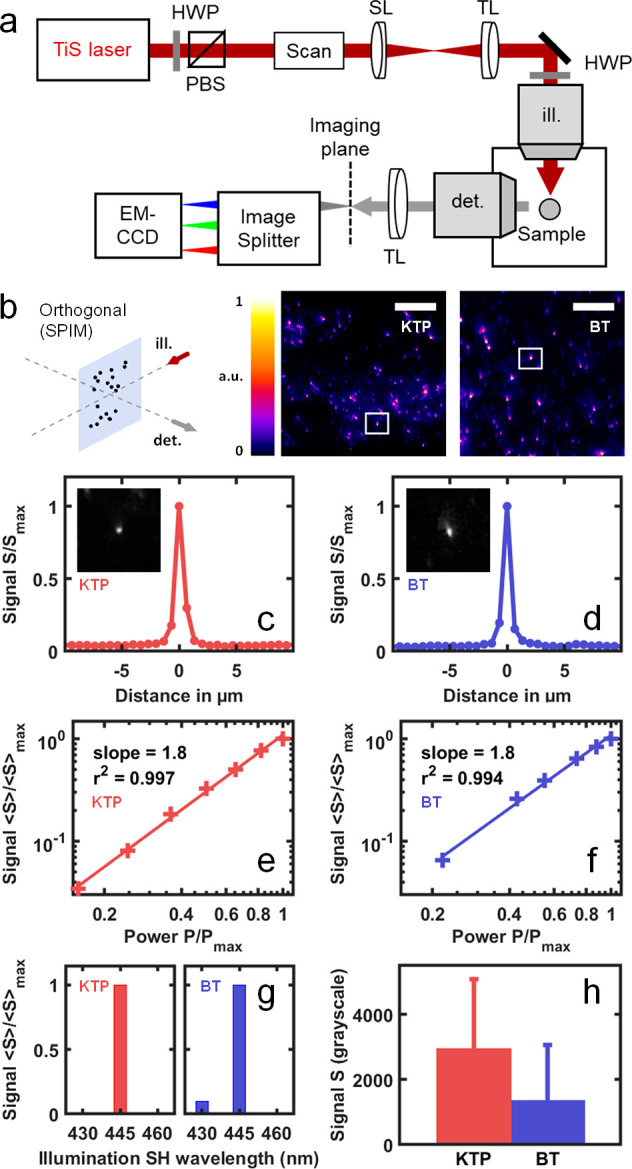
SHG signals from KTP and BT nanocrystals can be detected using the orthogonal geometry of a multiphoton light-sheet microscope. (a) Multiphoton light-sheet microscope (SPIM) setup. (b) SHG nanoprobes were mounted in agarose gel and imaged in orthogonal geometry (SPIM) at λ = 930 nm. (c, d) Normalized SHG signal profiles depending on the horizontal distance to KTP (c, red) and BT (d, blue) nanocrystals selected from Figure 1b images (insets in c and d and white boxes in b). (e, f) Quadratic dependence of normalized averaged SHG signal ⟨S⟩/⟨S⟩max on normalized illumination power P/Pmax is observed from both KTP (e, red) and BT (f, blue). (g) Spectral selectivity of SHG nanoprobes is observed by measuring the mean SHG signal detected using a 448/20 bandpass detection filter depending on illumination wavelengths (λ = 860, 890, and 920 nm). (h) Comparison of SHG signal levels obtained from KTP and BT nanocrystals in similar imaging conditions. HWP, half waveplate; SL, scan lens; TL, tube lens; PBS, polarization beam splitter; SH, second harmonic; ill., illumination; det., detection. Scale bar is 50 μm.