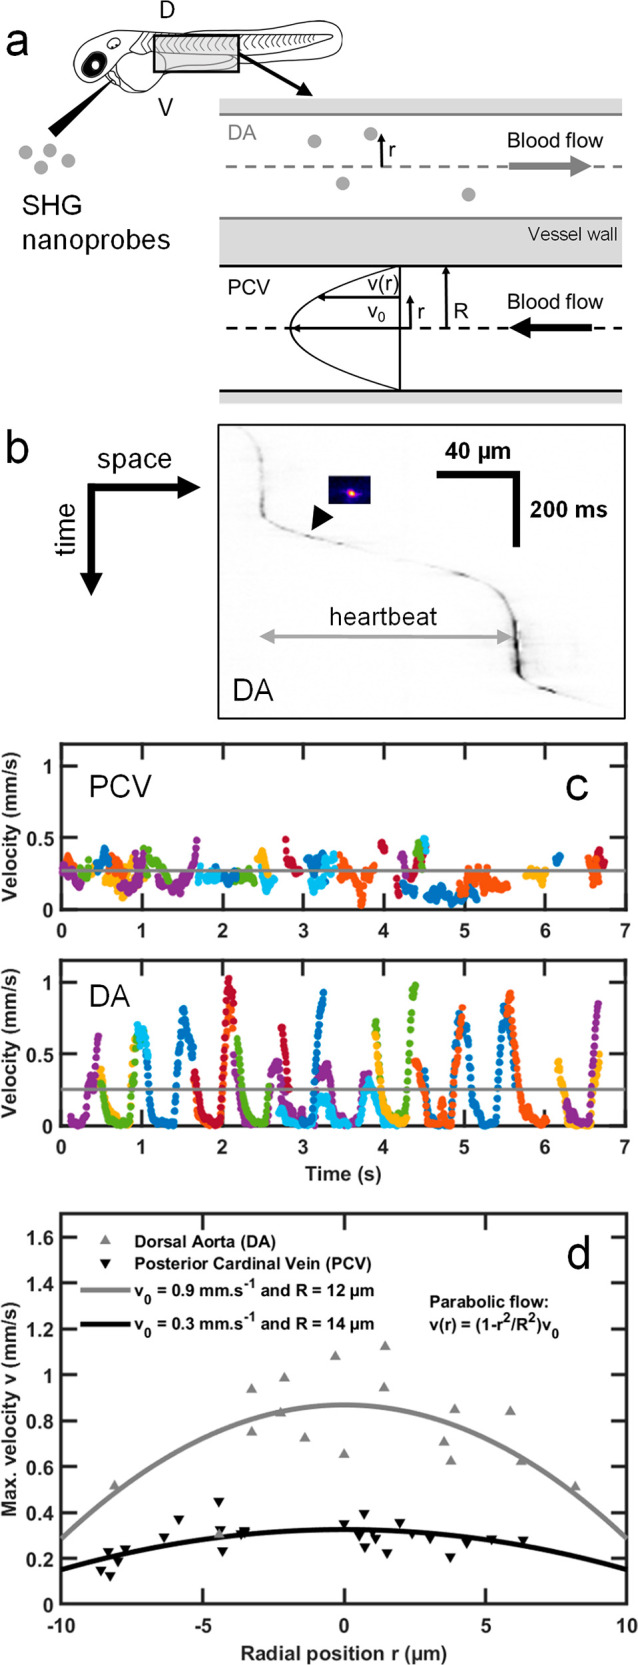
Figure 2.

Microangiography in zebrafish embryos using fast in vivo SHG imaging and tracking of individual SHG nanoprobes seeding the blood flow. (a) KTP nanocrystals were injected in the blood vessels of 2 dpf zebrafish embryos and were imaged in both the dorsal aorta (DA) and the posterior cardinal vein (PCV). Single nanoprobes were tracked along the blood vessel and trajectories were constructed for each particle. (b) Kymogram (space–time graph with inverted grayscale signals) of representative tracked SHG nanoprobe (inset image) seeding the dorsal aorta and exhibiting a pulsatile movement. (c) Cumulative plot of KTP nanocrystal speeds during 12 heartbeats. Nineteen and 37 nanocrystals flowing in the DA and the PCV, respectively, were imaged in vivo at 140 fps and tracked. Their instantaneous velocities are drawn as a function of time. Different trajectories (in different colors) were used to construct the plotted profiles. The pulsatile nature of their movement in the DA, owing to the systole/diastole cycles, enables extracting the heartbeat frequency, which is ∼2 Hz. The mean velocity is indicated with gray lines (250 ± 80 and 270 ± 20 μm/s, for DA and PCV, respectively). (d) Microangiography and in vivo tracking of individual SHG nanoprobes flowing in blood vessels demonstrates different velocities along the vessel’s diameter. Shown are two plots taken from the DA (gray, up-pointing triangles) and from the PCV (black, down-pointing triangle). The trajectories were drawn with respect to the position r of the trajectory along the diameter of the blood vessel (a), where the center was estimated as the average of the two most peripheral trajectories in the respective blood vessel. In general, particles were found to maintain their relative position along the vessel, with respect to their initial positions. The plots show that particles that flow in the center exhibit an overall higher range of flow velocities (max. velocities correspond to the average of the 5% fastest time points during a track) compared to particles that are close to the vessel walls, as expected from a parabolic flow (gray and black lines, for artery and vein, respectively, represent parabolic fits).
