
Figure 4.
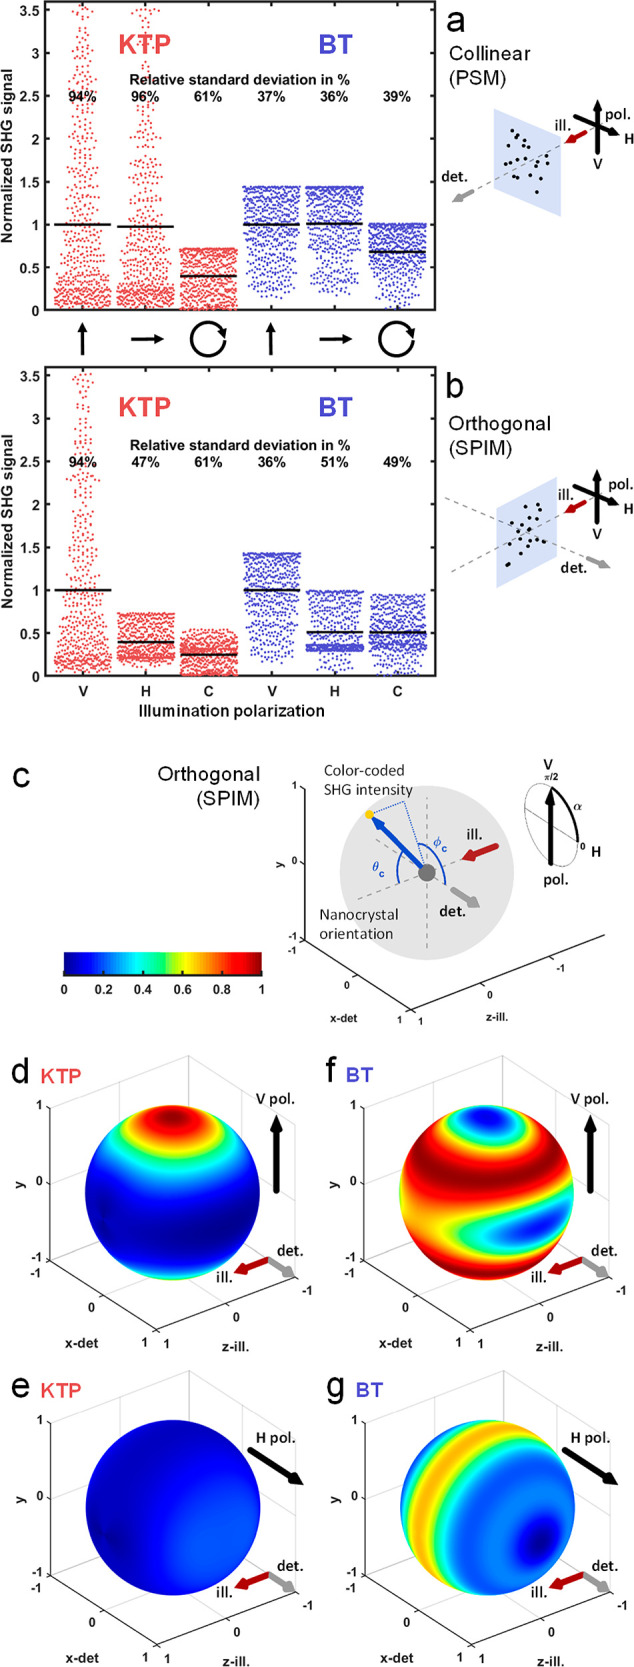
Detected SHG signal distribution depending on nanocrystal orientation and illumination polarization: theoretical investigation. (a, b) Simulation of SHG signal distributions from 500 KTP (red) and BT (blue) nanocrystals using linear vertical (V), linear horizontal (H), or circular (C) polarization of the illumination light in the collinear (a, PSM) or orthogonal (b, SPIM) geometry, using a 0.8 detection numerical aperture (NA). Random distribution of nanocrystal orientation results in spreading of signal levels around the mean (black horizontal lines). Signal for each polarization is normalized to the vertical polarization case. Signal mean and relative standard deviation are indicated for 10 000 nanocrystals simulated with random orientations. (c–g) Signal intensity distribution for all possible nanocrystal orientations for KTP (d, e) and BT (f, g) nanocrystals using vertical (d and f) or horizontal (e and g) linear polarization in SPIM with a 0.8 detection NA. Results are represented on a unit sphere, where the position on the sphere corresponds to the nanocrystal orientation relative to the microscope reference frame as shown in (c), and color corresponds to the signal intensity detected. Red, gray, and black arrows correspond to the SPIM illumination axis, detection axis, and linear polarization orientation, respectively. Represented signal is a spline interpolation of signals from 4000 nanocrystals simulated with random orientations. The signal level is normalized to the maximum value in each case. ill., illumination; det., detection; V, vertical; H, horizontal.