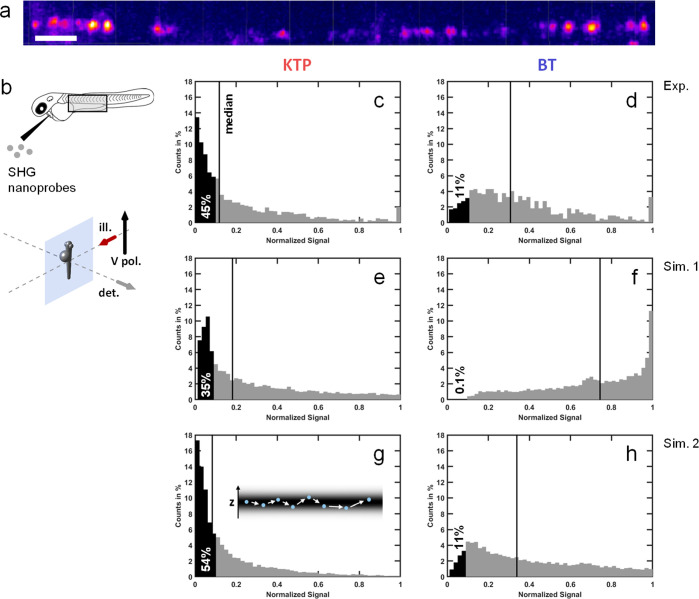
Figure 5.
Optimizing SHG signals detected from individual SHG nanoprobes experiencing rotational motion: experimental investigation. Analysis of SHG nanoprobe signal recorded in vivo shows that BT and KTP nanocrystals generate different patterns of dynamic ranges as they flow. (a, b) A solution containing SHG nanoprobes was injected to a zebrafish embryo and imaged at 140 fps and 5 ms exposure time using SPIM with vertical linear polarization of the excitation beam. Single nanoprobes were tracked off-line. Shown in (a) is a maximal projection of selected time points where the different locations of a single BT nanocrystal in the blood vessel of a zebrafish embryo can be seen (scale bar 20 μm). (c, d) Histograms depicting the signal levels of KTP (c) and BT (d) nanocrystals that were tracked in data sets such as the one presented in (a). For each of the particles that were tracked off-line, a trajectory of the particle’s path was constructed, and the intensities in the different positions were then normalized to the maximal value along that trajectory. The histograms depict the pooled data from all trajectories per particle type. Note that the BT histogram is more skewed to the right-hand side with respect to the KTP histogram, suggesting that while a BT nanocrystal is flowing and rotating, its range of generated SHG intensities is closer to the maximal intensity, compared to KTP. (e, f) Simulated histograms (Sim. 1) corresponding to the previous experimental cases (c, d) confirming the difference between KTP and BT nanocrystals: the histogram is skewed to low intensities in the case of KTP (e) and to high intensities in the case of BT (f). (g, h) By adding the random positioning of the nanocrystals through the z-thickness of the light-sheet to the simulation (Sim. 2), the resulting histograms are similar to experimental ones. sim., simulation; exp., experiment.

