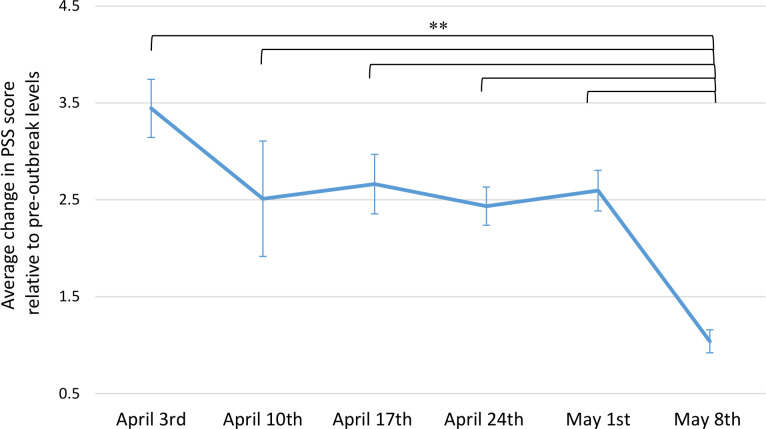
Figure 3.
Patterns of stress changes across time. Average changes in score on the Cohen’s Perceived Stress Scale (PSS) from pre-outbreak to during the outbreak (ie, current PSS minus pre-outbreak PSS; higher scores indicating stress worsening) measured cross-sectionally across each time period of survey completion (each comprising 7 days starting on the date of the survey launch). Higher change scores reflect higher stress worsening relative to pre-outbreak stress levels. Error bars indicate the SE of the mean. Sample sizes for each 7 day time period are as follows: April 3rd: n=516, April 10th: n=135, April 17th: n=453, April 24th: n=1035, May 1st: n=936, May 8th: n=2028. **p<0.001.

