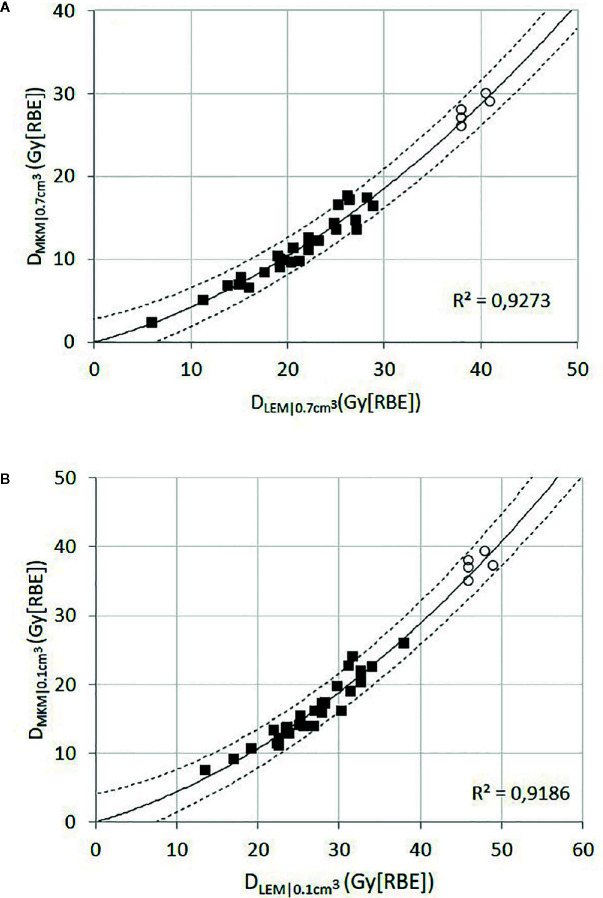
Figure 3.
Black squares represent the relationship of D LEM I to D MKM for the dose metrics D0.7 cm3 (A) and D 0.1 cm3 (B) for each individual brainstem. The solid line represents the quadratic function providing the best fit to the data points (black squares), assuming that the intercept should be in the origin. The dashed lines represent the 95% CI. The open circles represent the data collected from the reoptimized plans; these data points were not used for the curve fitting procedure.

