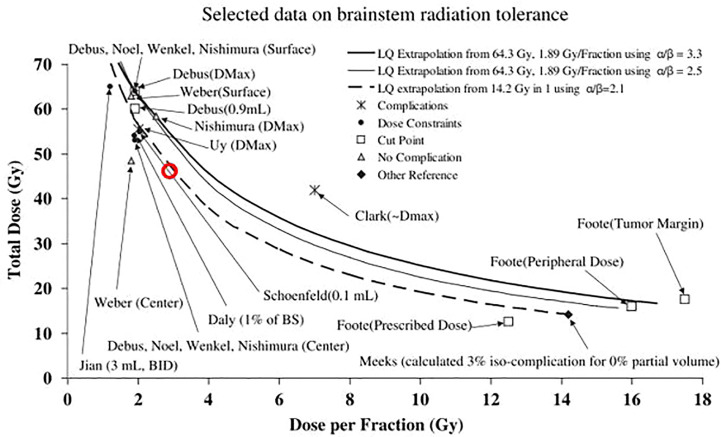
Figure 6.
Figure 1 from Mayo et al. (23) reprinted with permission, comparing selected data on brainstem tolerance and dose constraints from stereotactic RT or normofractionated photon or proton RT, compared with the linear quadratic (LQ) model extrapolations. Data points are marked with the corresponding author and dose parameter considered in parenthesis. The D LEM I|0.1 cm3 <46 Gy (RBE) constraint for a 16-fraction LEM I-optimized CIRT, estimated by dose translation of the corresponding D MKM constraint is superimposed as a red circle on the original figure.

