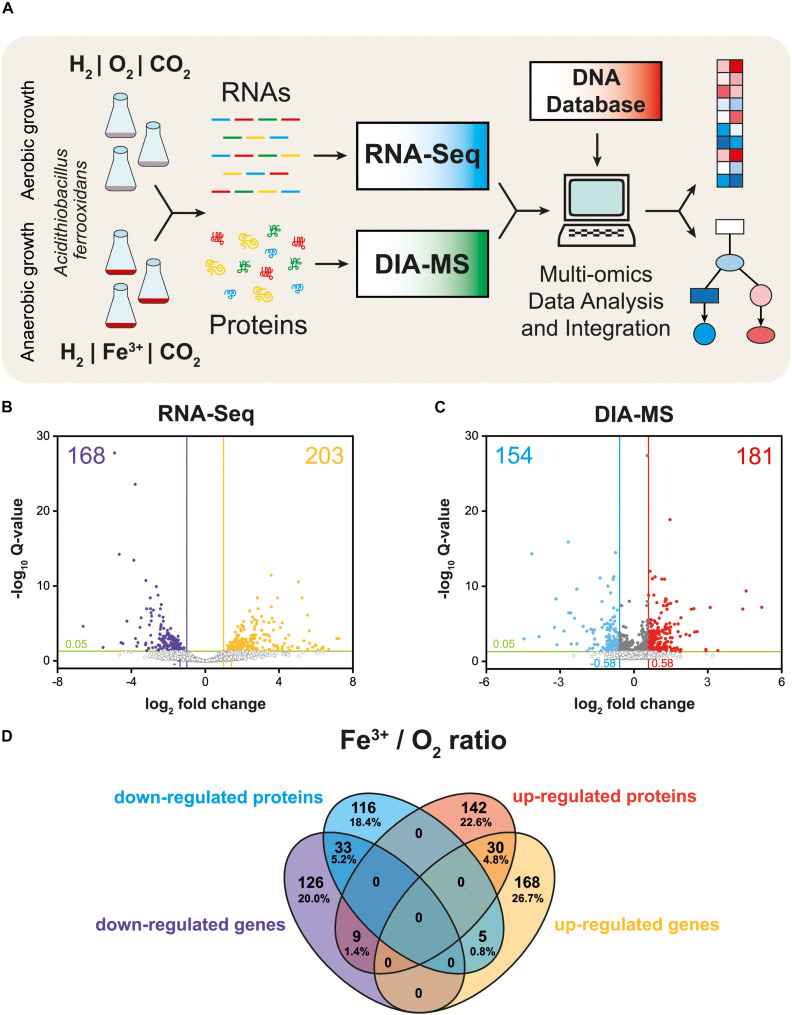
FIGURE 1.
Multi-omics analysis of aerobically and anaerobically grown At. ferrooxidans cells with hydrogen as an electron donor. Experimental design including cultivation, next-generation sequencing, quantitative proteomics, and bioinformatic data analysis (A). Volcano plot representing all expressed genes (B). Volcano plot representing all identified proteins (C). Closed circles indicate gene transcripts and proteins that changed significantly (q < 0.05); colored circles indicate significant fold change (|log2 fc| > 1 for gene transcripts, and 0.58 for proteins, respectively). Venn diagram displays significant differentially expressed genes (DEGs) and proteins (DEPs) values (q < 0.05) with |log2 fc| > 1 for gene transcripts, and 0.58 for proteins, respectively (D).

