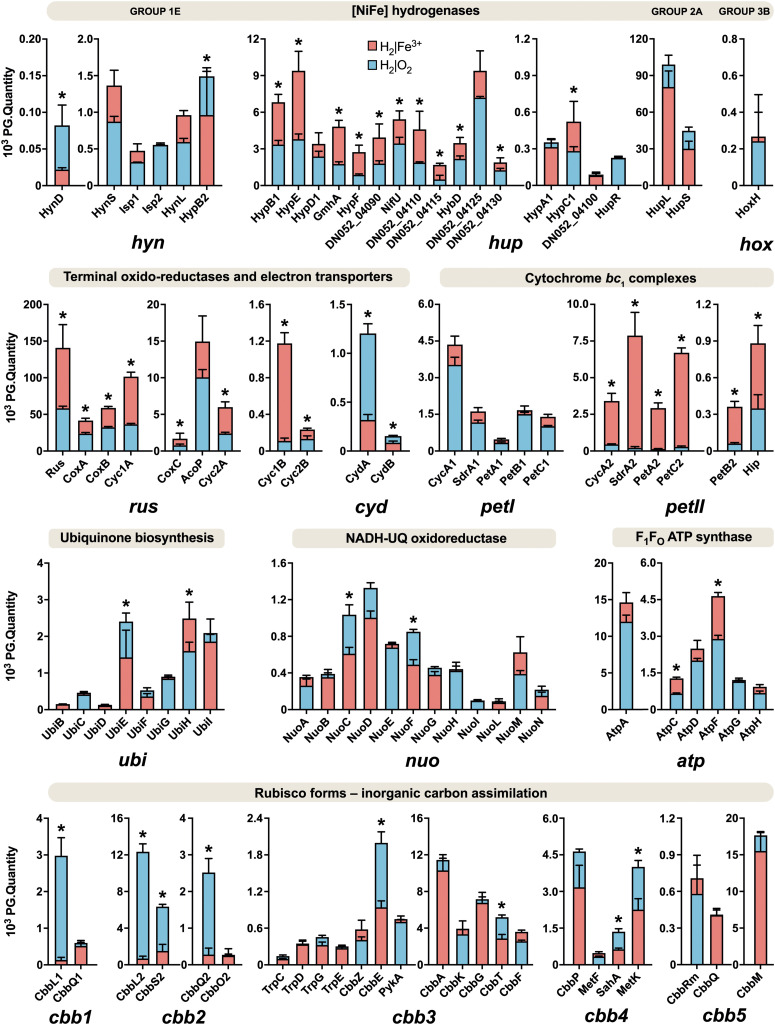
FIGURE 3.
Relative abundances of energy metabolism proteins in aerobically and anaerobically grown At. ferrooxidans cells with hydrogen as an electron donor. Blue bars represent aerobic growth (electron acceptor: oxygen), and red bars represent anaerobic growth (electron acceptor: ferric iron). An asterisk indicates a significant change between the aerobic and anaerobic growth (|log2 fold change| > 0.58 and q < 0.05). Error bars are standard deviations of triplicate analyses.

