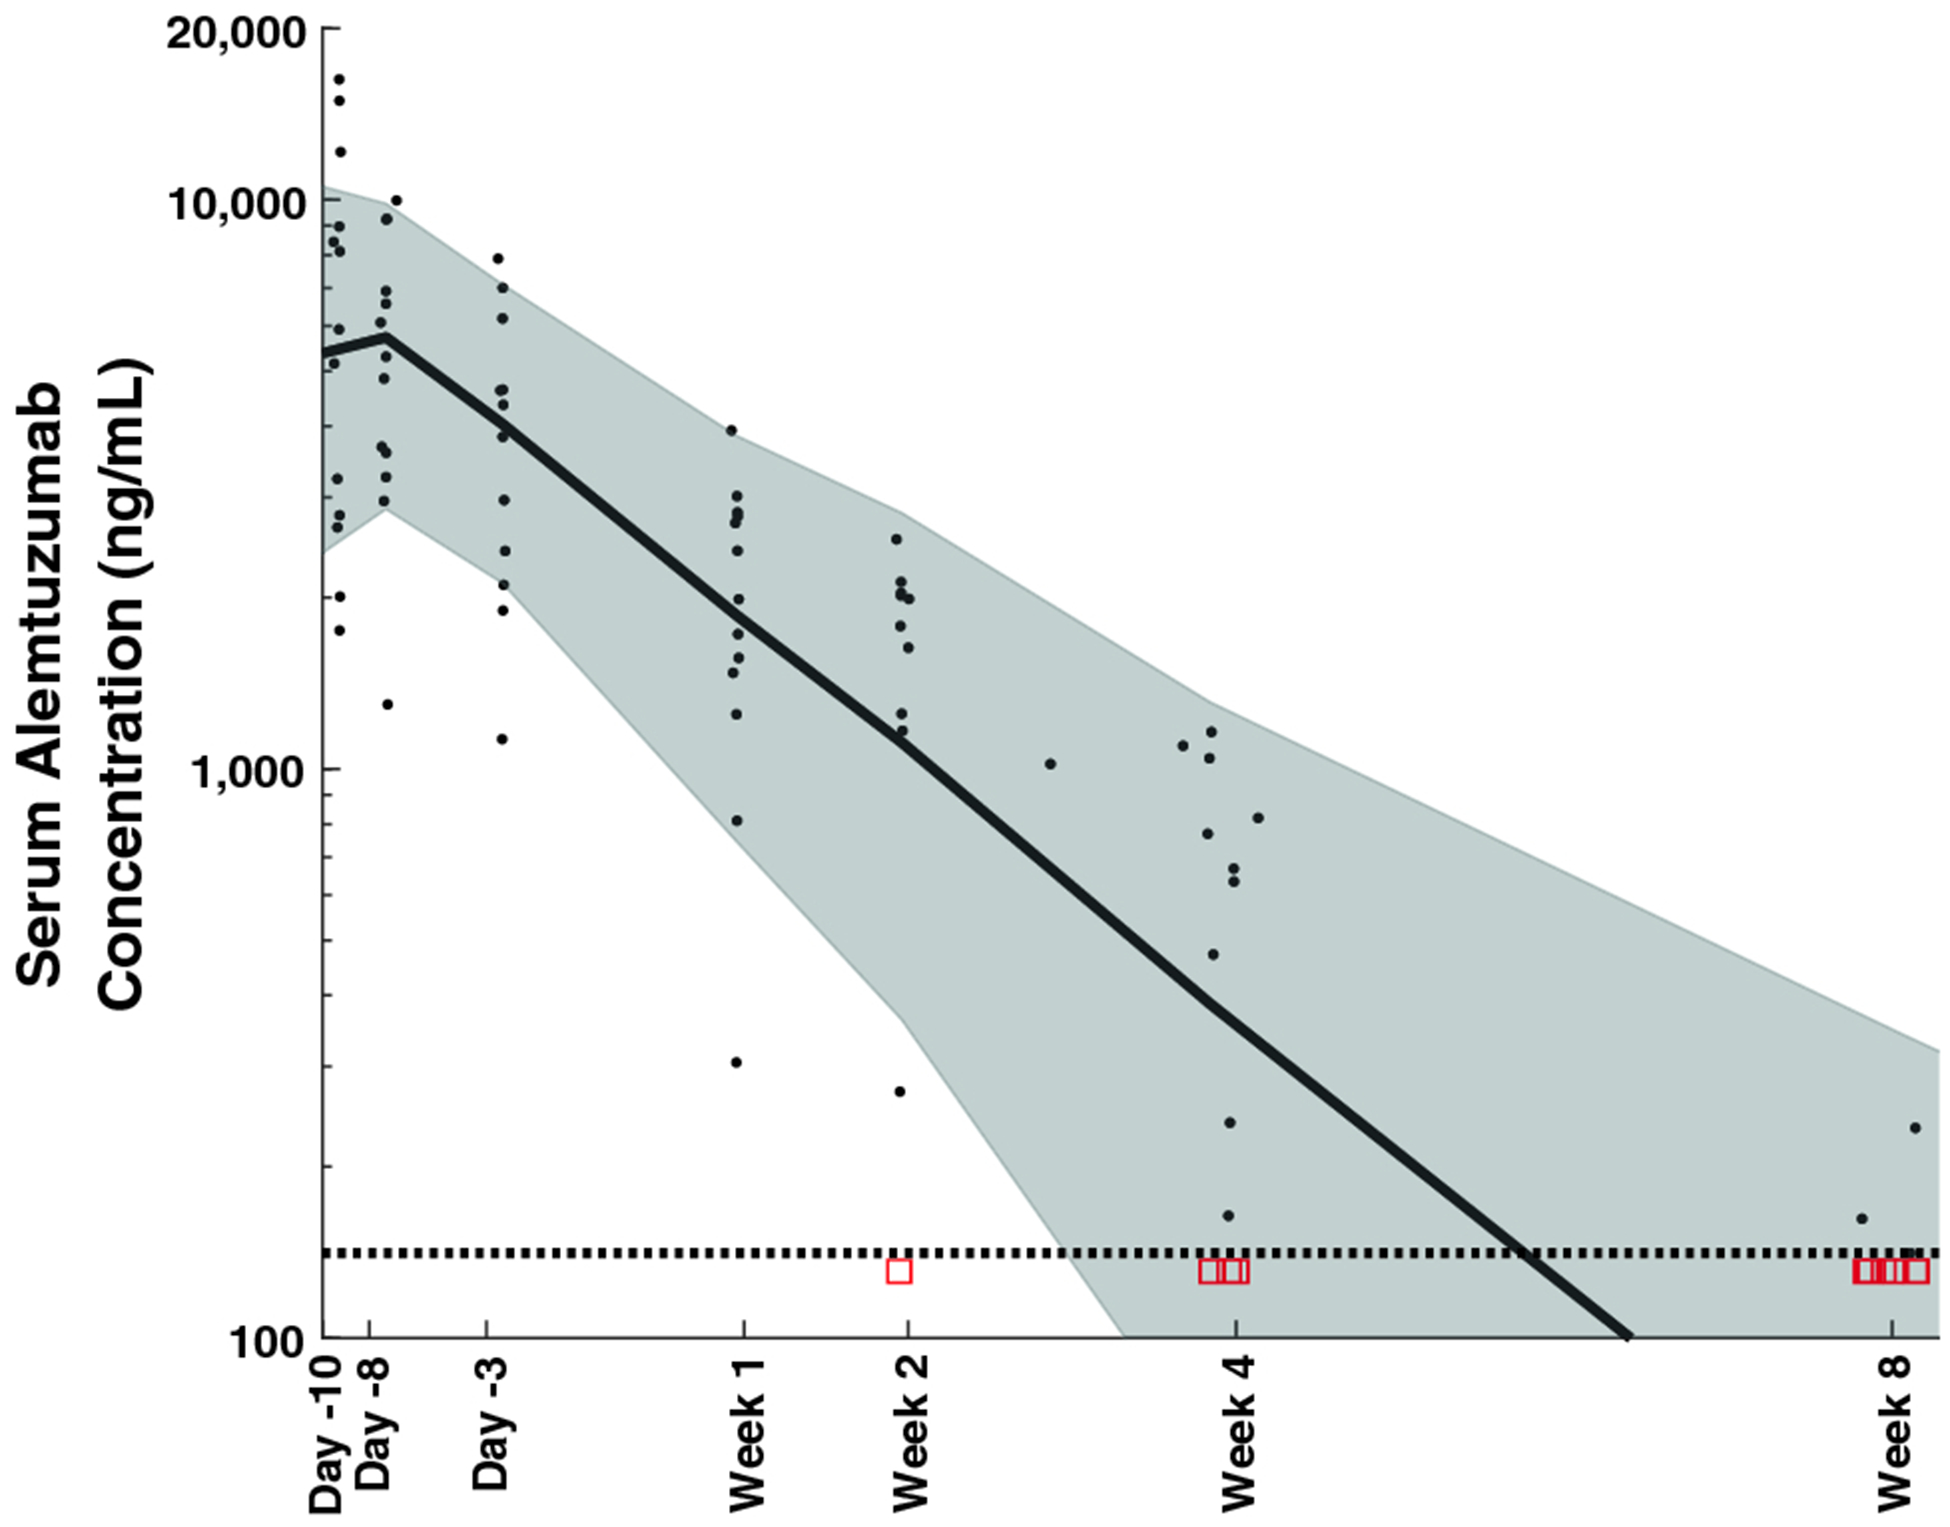
Figure 2.

Alemtuzumab concentration versus time and Visual Predictive Check. The black dots represent the measured concentrations and the red squares represent censored data (plotted at the LLOQ). The solid black curve is the population predicted median curve and the grey shaded region represents the population predicted 10th to 90th percentile. The horizontal dotted line represents the lower limit of quantification of the assay (141 ng/mL).
