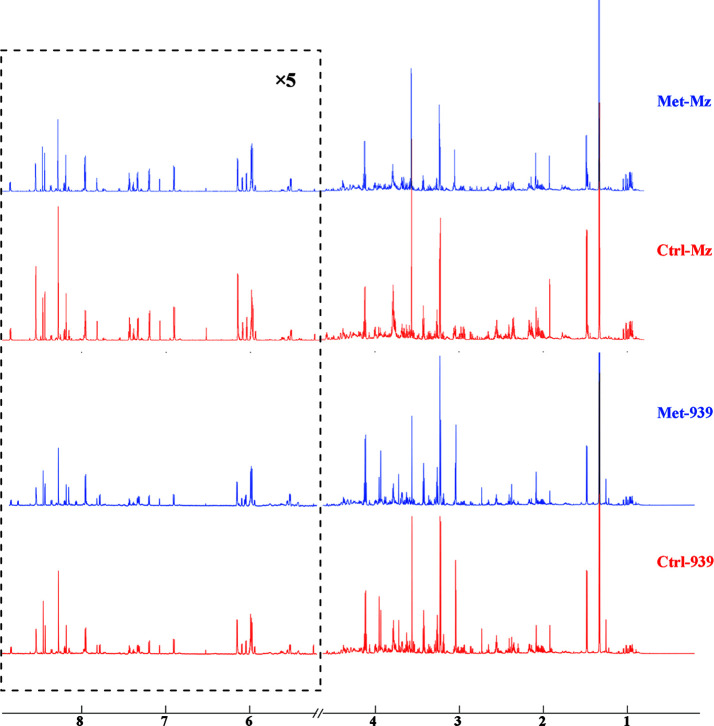
Figure 2.
Averaged 1D 1H NOESY spectra of aqueous metabolites derived from the metformin-treated and control groups of both CCA cells. Spectral regions of 1.0–4.6 and 5.2–9.0 ppm were reserved, and the water region (4.6–5.2 ppm) was removed. Spectral regions of 5.2–9.0 ppm were scaled for 5 times. Met-Mz and Met-939 represent the groups of metformin-treated Mz-ChA-1 cells and QBC939 cells with metformin treatment, respectively. Ctrl-Mz and Ctrl-939 stand for the groups of Mz-ChA-1 cells and QBC939 cells without metformin treatment, respectively.

