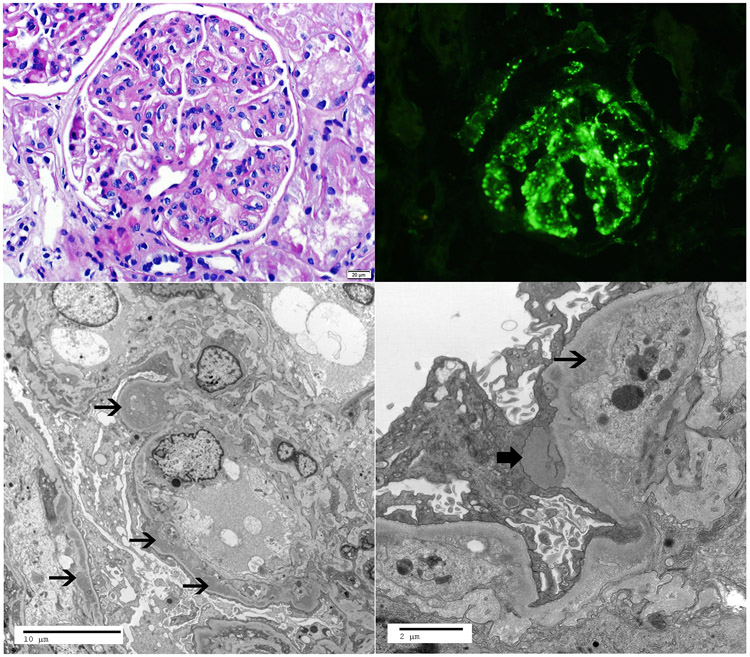
Figure 2:
Representative kidney biopsy of C3G with monoclonal Ig. A. Light microscopy showing a membranoproliferative glomerulonephritis (periodic acid Schiff stain, 40x), B. Immunofluorescence microscopy showing bright mesangial and capillary wall staining for C3 (40x), C-D. Electron microscopy showing subendothelial deposits (thin arrows) and a subepithelial deposit (thick arrow) (C-2900x, D-9300x).

