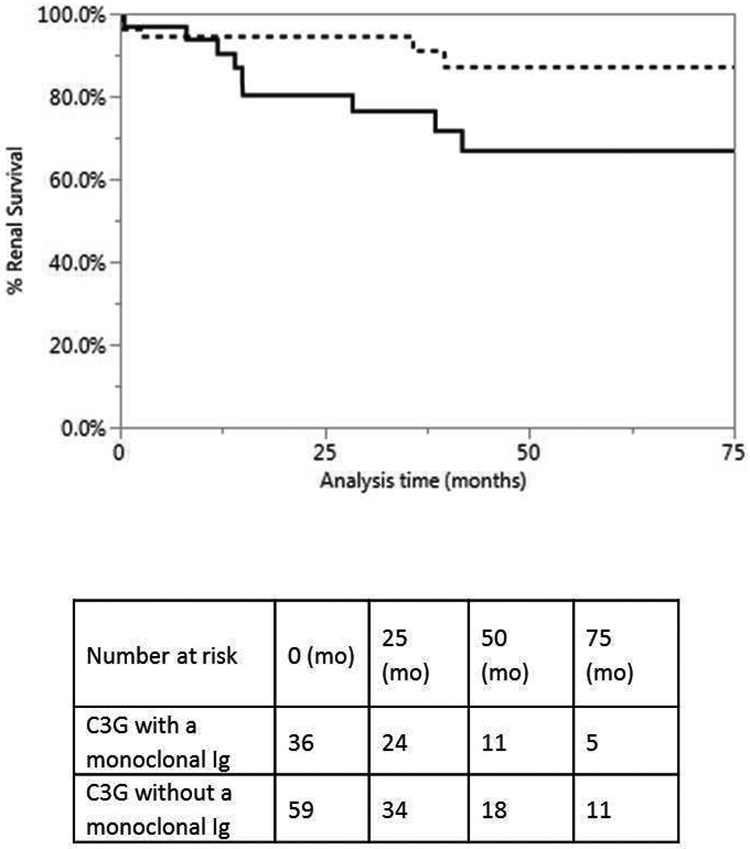
Figure 3:

Kaplan-Meier analysis of renal survival in C3G patients with and without a monoclonal Ig. Black line represents C3G with monoclonal Ig and dotted line represents C3G without monoclonal Ig; mo: months. The analysis demonstrates no significant difference in ESRD free renal survival in C3G patients with and without monoclonal Ig (p= 0.0791).
