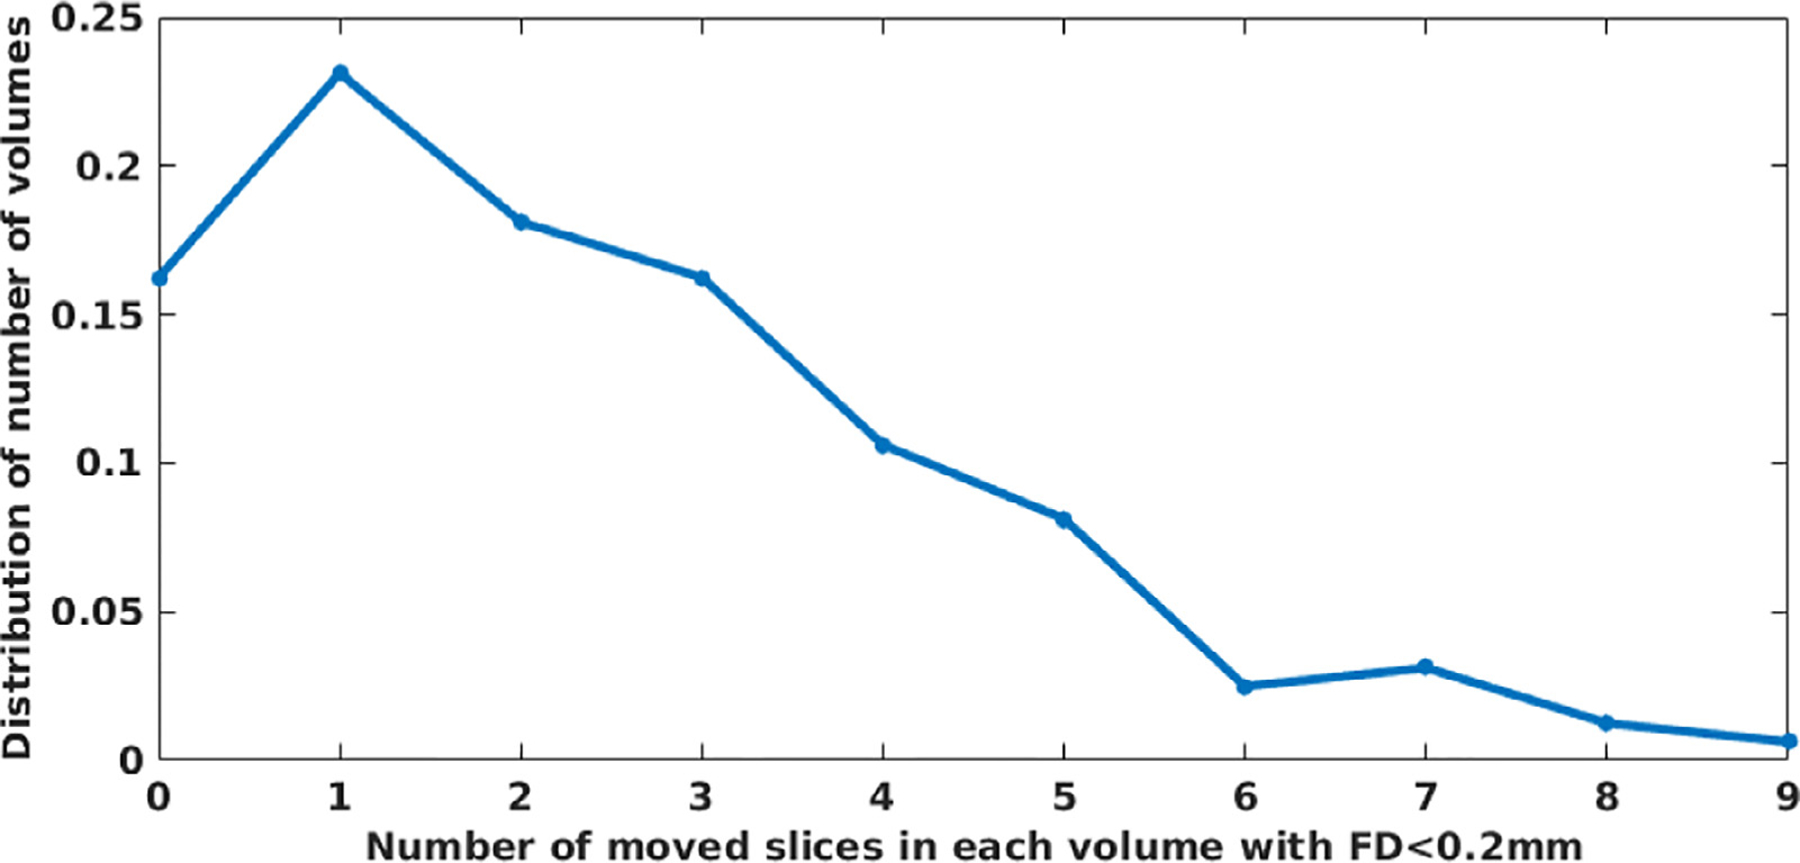
Fig. 5.

Distribution of the number of volumes over number of moved slices in each volume with FD < 0.2 mm on the EM-Tracking data set. Only 16.5% volumes had all slices displaced less than 0.2 mm, while the rest of the volumes contained at least one slice subject to SD ≥ 0.2 mm. The figure shows that much of the time a volume has an FD < 0.2 mm it still has slices displaced more than 0.2mm.
