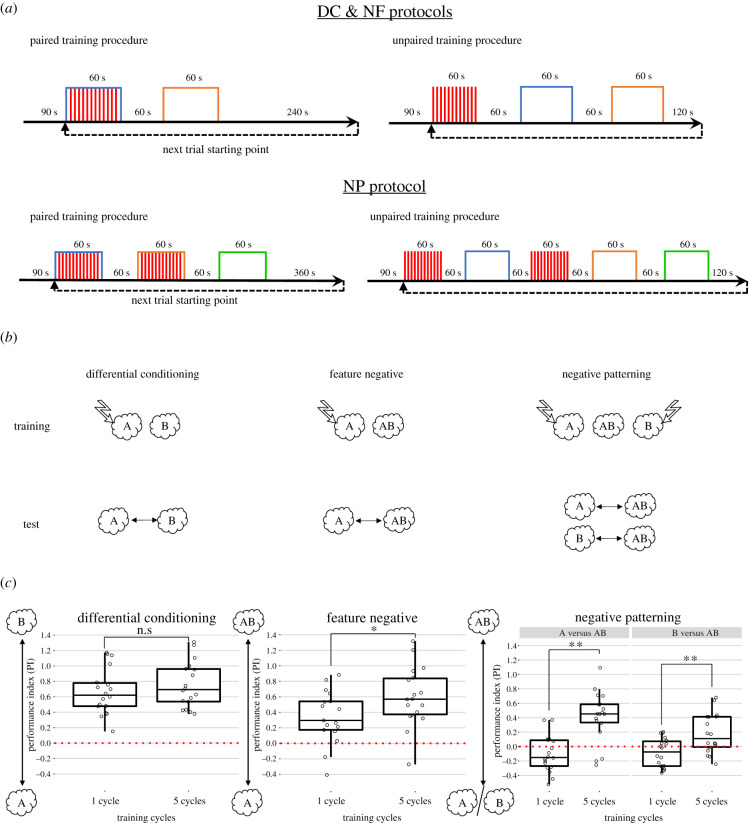
Figure 1.
(a) Schematic of a typical training cycle. Blue and orange boxes show CS presentation, while red bars show US delivery. (b) Schematic of the conditioning protocols. Clouds represent the CS odorants while lightning bolts indicate the delivery of electric shock during training. A, 3-octanol; B, 4-methylcyclohexanol. (c) Relative PIs computed as the difference between paired and unpaired scores. Performances were compared within the same protocol (i.e. one cycle versus five cycles) but not between protocols. Data are plotted as boxplots. The middle line represents the median, while the upper and lower limits of the box are the 25 and 75% quantiles. The whiskers are the maximum and minimum values of the data that are, respectively, within 1.5 times the interquartile range over the 75th percentile and under the 25th percentile. Raw data are superimposed as jittered dots. ‘n.s.’ stands for ‘non-significant’, *p < 0.05, **p < 0.01 after a t-test (DC and NF) or after a two-way ANOVA (NP).

