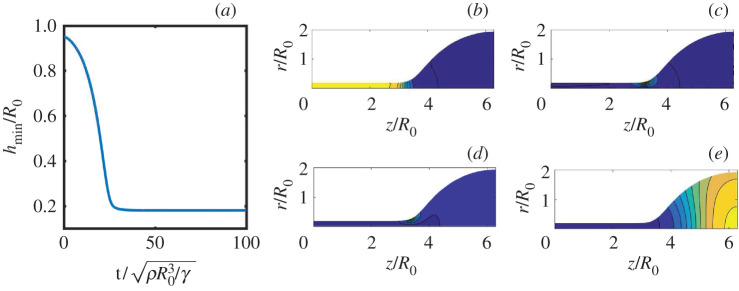
Figure 5.
(a) Time evolution of the minimum thread radius for the viscoelastic solid, simulated by an Oldroyd-B fluid with λ = ∞. Parameters are ϵ = 0.05, and μR0/γ = 0.0119. (b–e) Polymeric stresses in the final state of the fluid simulation: (b) σp,zz; (c) σp,zr; (d) σp,rr; (e) σp,θθ. The purple to yellow (dark to light) colour gradient represents the change from minimum to maximum stress, respectively. (Online version in colour.)

