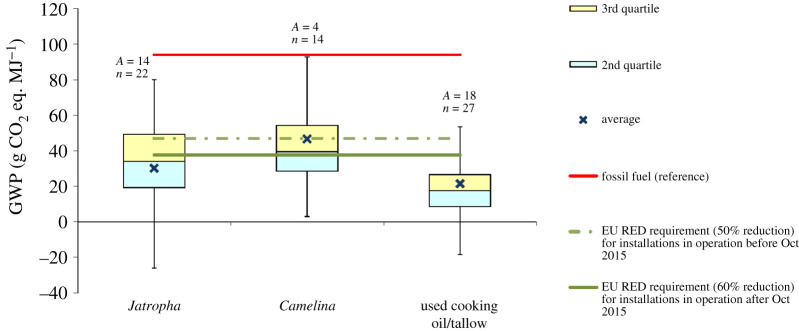
Figure 5.
GWP of second-generation biodiesel. Based on data from [20,47,89,90,97,108,164–189]. The negative values are due to the credits for co-products. For the box plot legend, see electronic supplementary material, figure S1 and for the data used to plot this graph, see electronic supplementary material, figure S5. ‘Fossil fuel (reference)’ is the average carbon intensity of petrol and diesel supplied in the EU (94 g CO2 eq. MJ−1) as specified in the RED [8]. ‘A’ refers to the number of LCA articles found in the literature and ‘n’ denotes the total number of analyses. (Online version in colour.)

