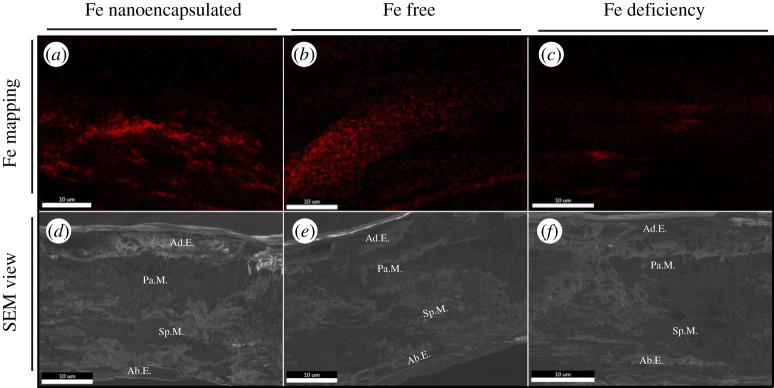
Figure 3.
Fe mapping of cross-sections of Prunus dulcis L. leaves by FESEM-X-EDS. The red colour represents the Fe signal. (a) 24 h after nanofertilizer application. (b) 24 h after free element application. (c) Deficient. SEM image of almond leaf section (d,e,f). Ab.E., abaxial epidermis; Sp.M., spongy mesophyll; Pa.M., palisade mesophyll; Ad.E., adaxial epidermis.

