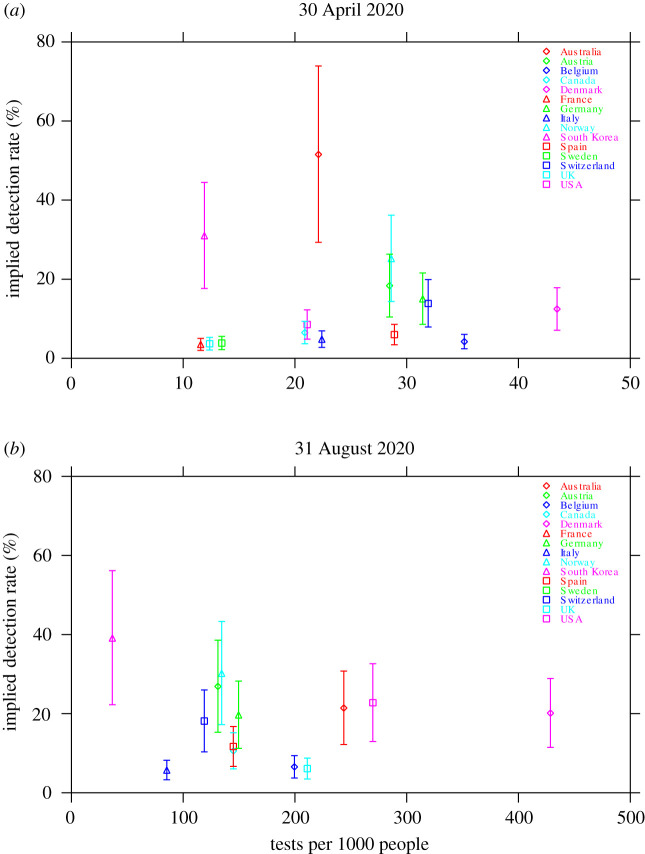
Figure 3.
The implied true detection rate for each country versus the number of tests per 1000 people: (a) 30 April 2020, and (b) 31 August 2020. Symbols indicate the median estimates and vertical bars indicate the 95% confidence intervals. Owing to a lack of available data, values for France and Sweden are not shown in (b). Note that the horizontal scale is different for each panel.

