
Figure 5. Second Harmonic Generation (SHG) imaging assessment of collagen fiber orientation in osteoarthritic mice.
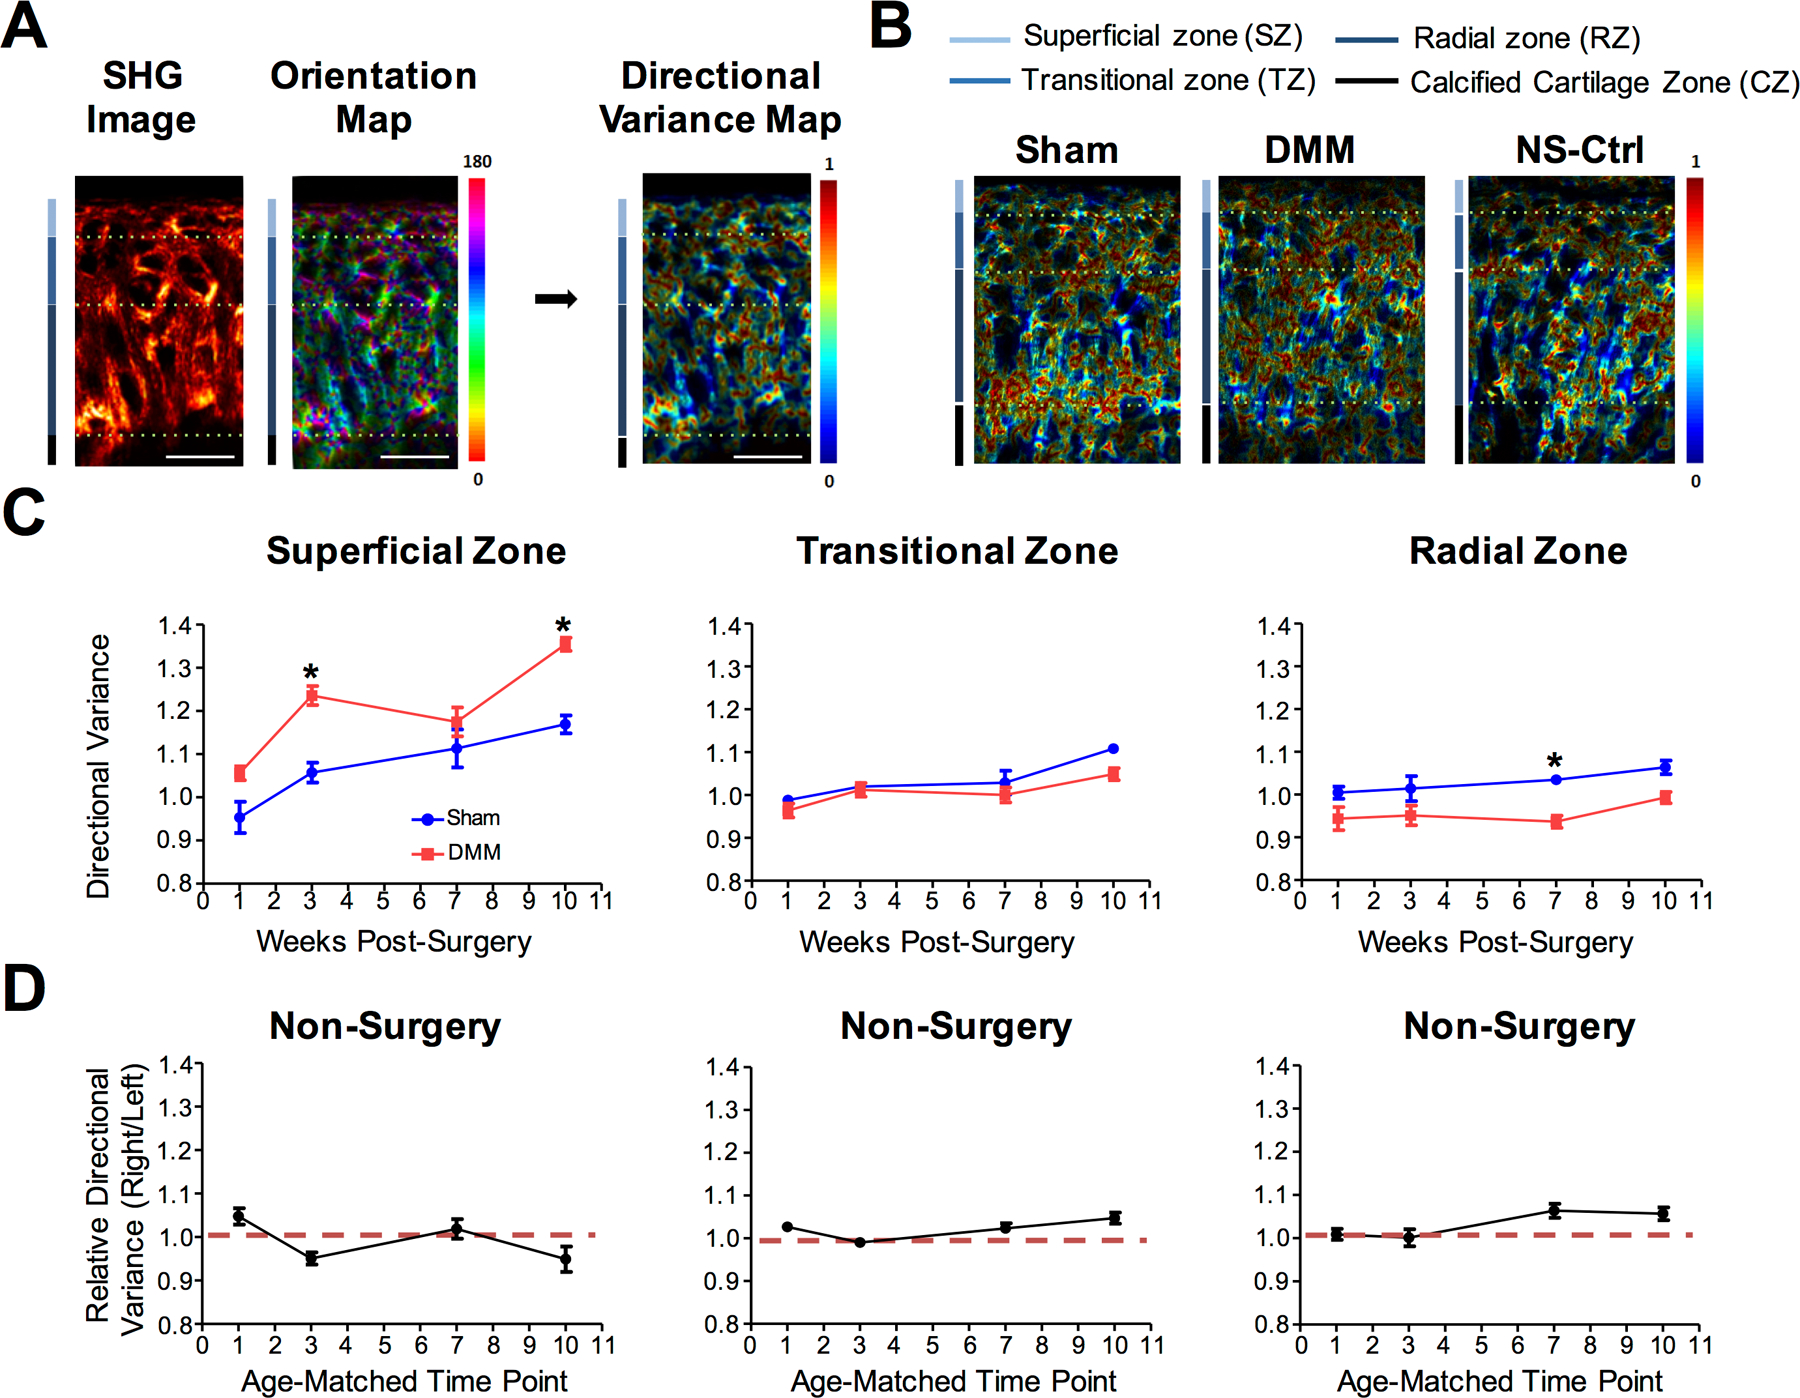
Cartilage of the tibial plateau of NFκB-RE-luc reporter mice were analyzed after DMM and Sham surgery at 1-, 3-, 7-, and 10-weeks. A) Illustration of analysis on SHG image to calculate the directional variance of collagen fibers. Scale bar = 25µm. B) Representative images of the directional variance heat maps for Sham, DMM, and age-matched non-surgery control. C) Quantification of collagen fiber directional variance in the superficial, transitional, and radial zones (n ≥ 5 for each time point). D) Quantification of directional variance of collagen fibers for age-matched non-surgery controls (right knee/ left knee) in the superficial, transitional, and radial zones. Comparisons were made between DMM and Sham values using ANOVA statistical analysis followed by Bonferroni’s post-hoc test. * denotes p≤ 0.05.