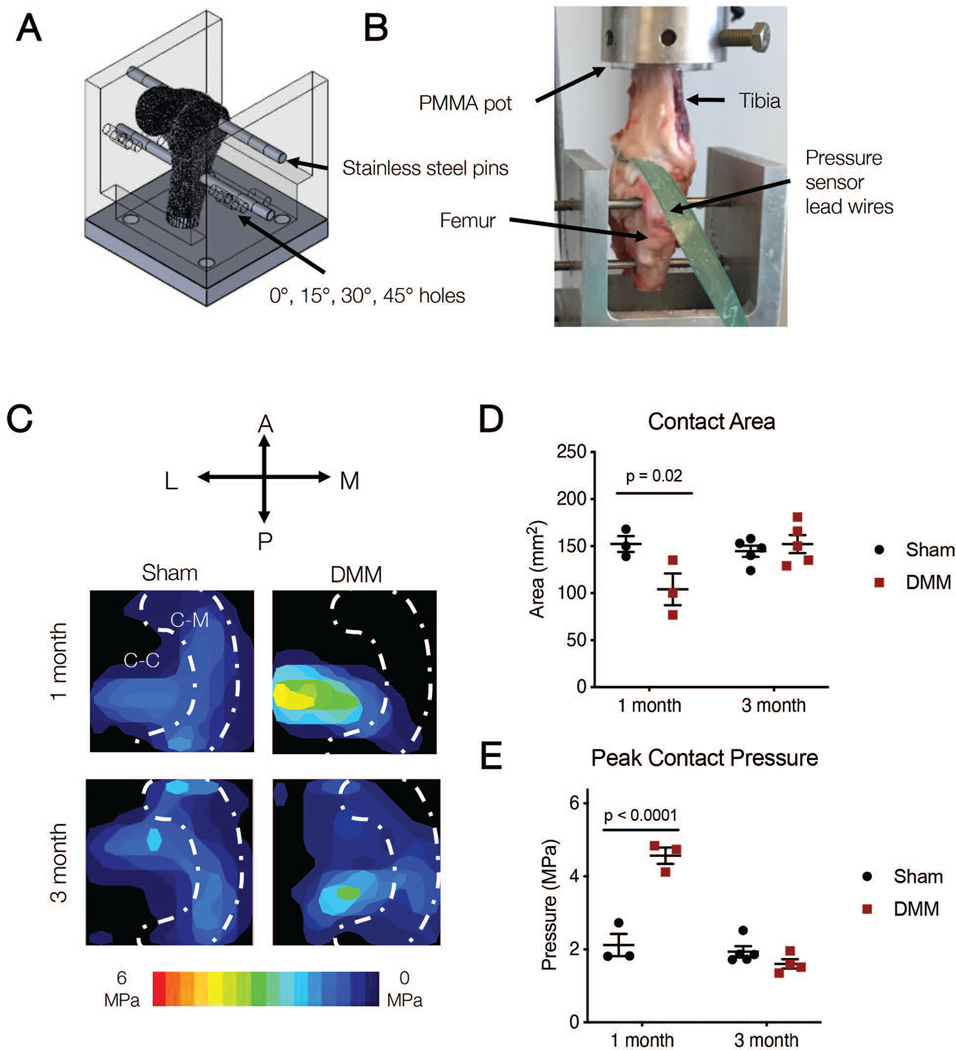
Figure 2.
A) Schematic of whole joint locked flexion angle loading rig, and B) photo of testing set up with inserted pressure sensor. C) Representative contact stress maps on the tibial plateau at 100 N total load on the tibial plateau at 45 degrees of flexion at one and three months. White dashed line outlines estimate of the location of the meniscus, showing Cartilage-Meniscus (C-M) and Cartilage-Cartilage (C-C) contact areas. D) Total contact area and E) peak contact pressure calculated from contact maps at 45 degrees of flexion at one and three months.

