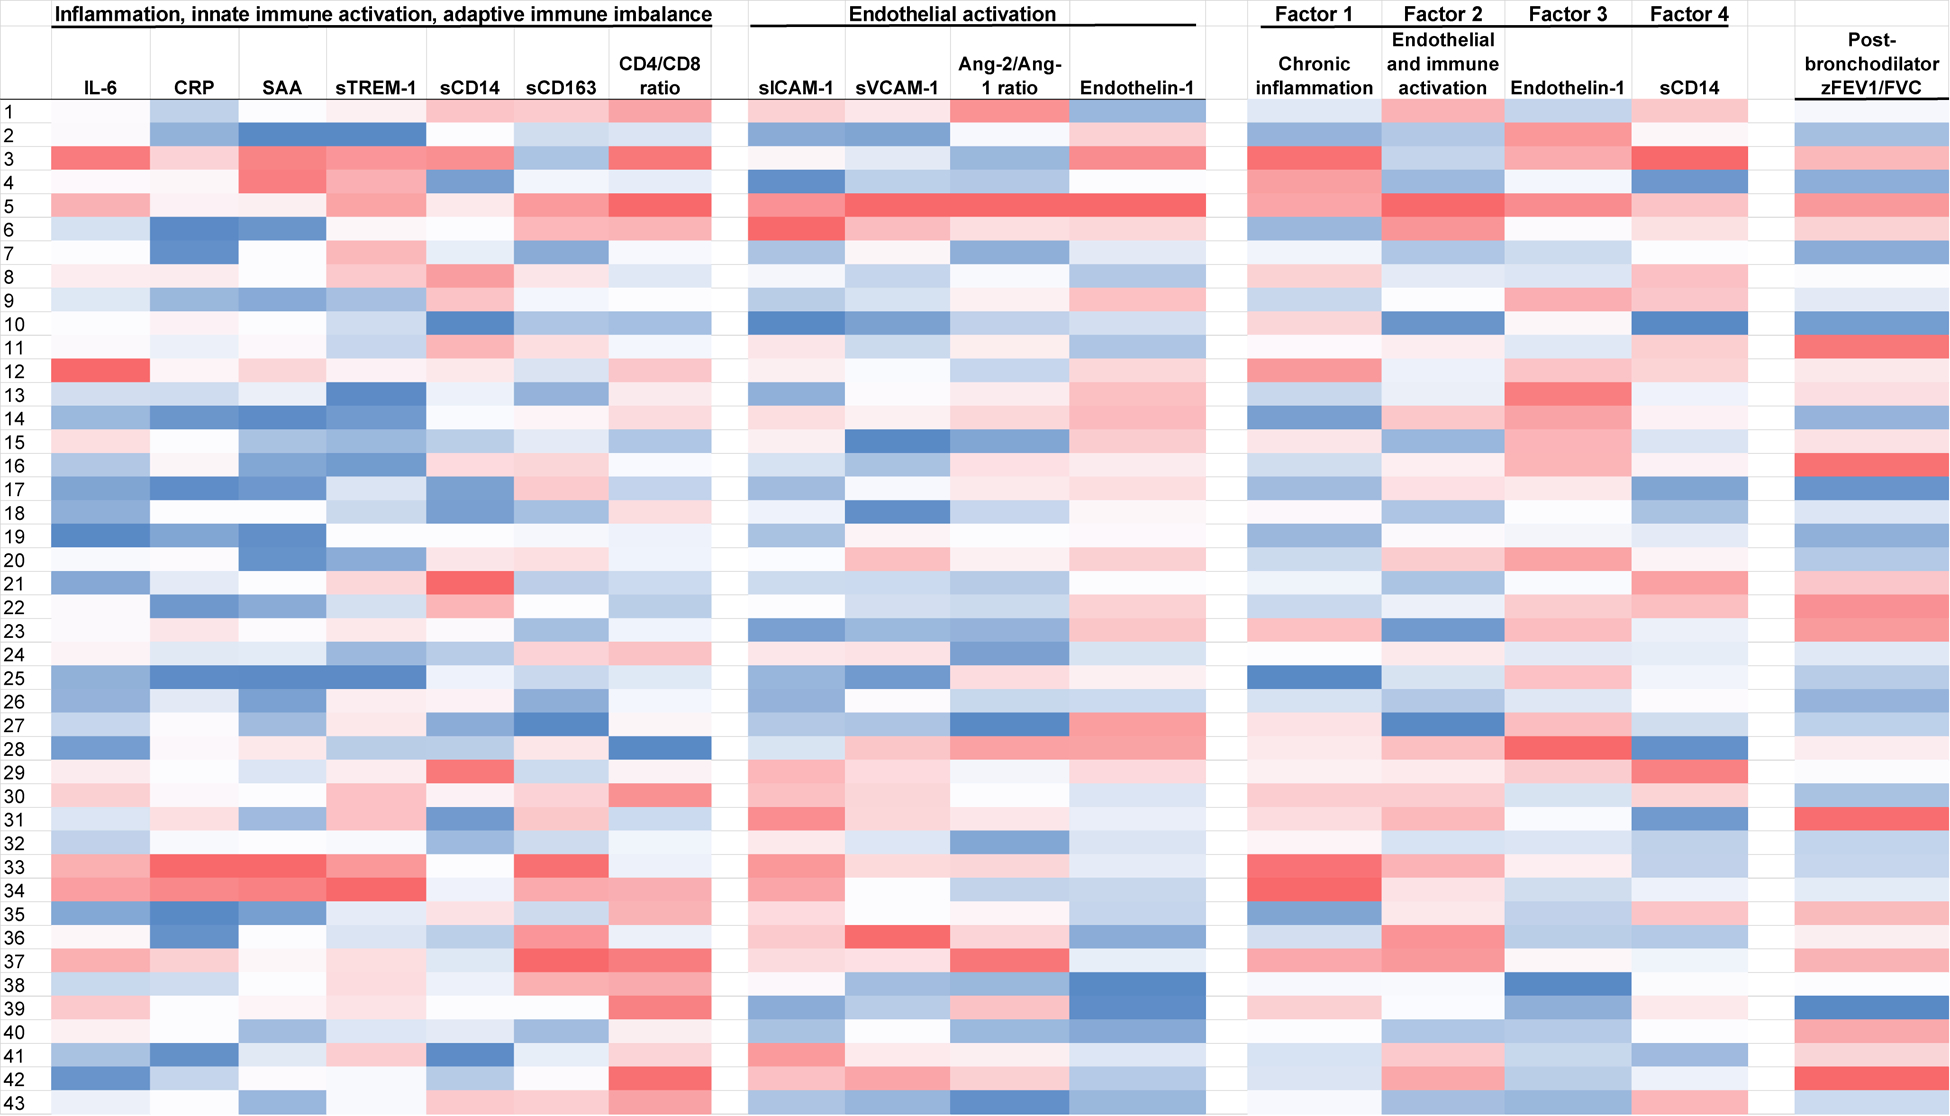
Figure 1. Heat map distribution demonstrates four independent factors that are differentiated by: 1) chronic inflammation, 2) endothelial and immune activation, 3) endothelin-1, and 4) sCD14.

The darker the shade of red, the higher (or worse) the biomarker, derived factor or outcome value is, with the exception of the CD4/CD8 ratio and the zFEV1/FVC ratio, as lower CD4/CD8 and zFEV1/FVC represent worse values. The opposite is true for darker shades of blue.
