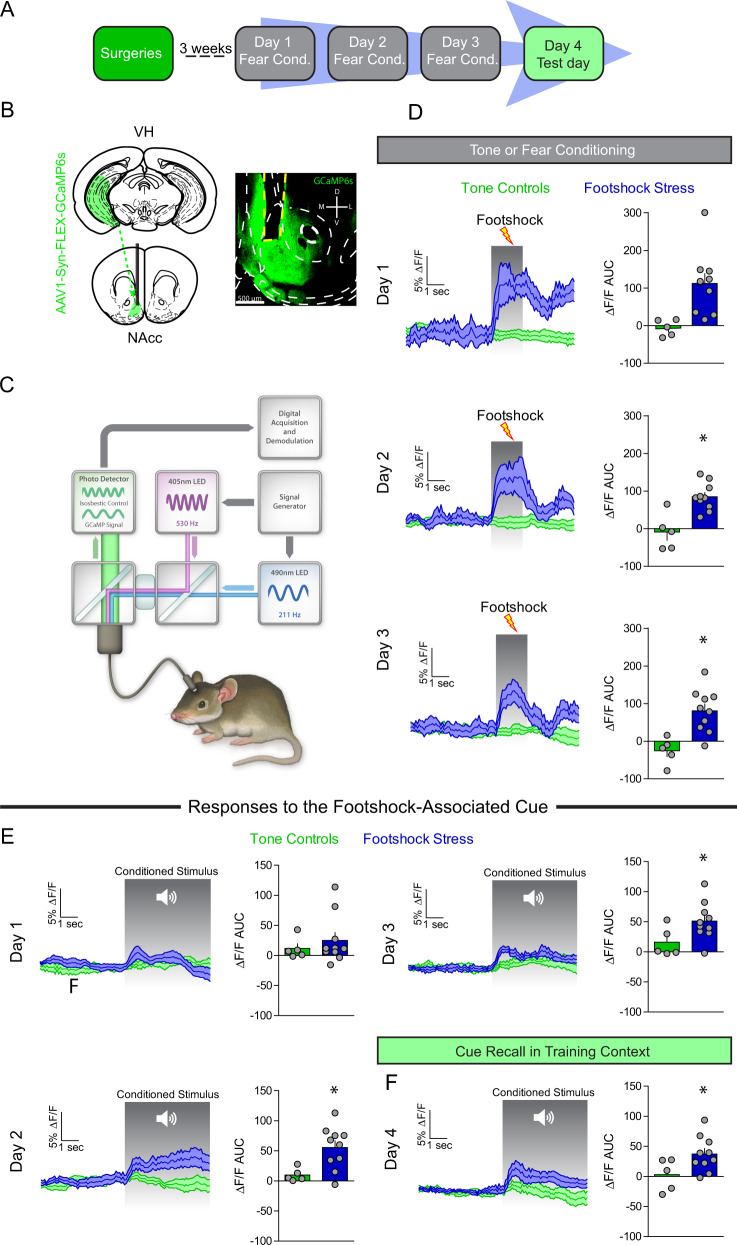
Fig. 2. VH afferents are recruited by footshock stress and stress-predictive cues.
a Experimental timeline. In vivo fiber photometry recordings were conducting during conditioning and fear recall procedures (days 1–4). b Schematic depicting AAV1-Syn-GCaMP6s injection into the VH and optical fiber implantation into the NAc of WT mice. Representative image of optical fiber and terminal GCaMP6 expression in the NAc from a mouse injected with AAV1-Syn-GCaMP6s into the VH. c Schematic of fiber photometry system. d Footshock-induced VH terminal Ca2+ activity in NAc over the course of the three days conditioning procedures. Left: time course of VH terminal Ca2+ dynamics during a 5 s window before and after a footshock. Right: area under the curve (AUC) of the ΔF/F. Day 1 (t-test; t(13) = 3.11, p = 0.008). Day 2 (t-test; t(13) = 4.23, p = 0.001). AUC day 3 (t-test; t(13) = 3.77, p = 0.002). e Cue-induced Ca2+ activity during tone or fear conditioning. Left: mean Ca2+ ΔF/F 5 s before and after the onset of the 20 s auditory cue. Right: AUC of the ΔF/F. AUC day 1 (n = 5–10; t-test; t(13) = 0.70, p = 0.50). AUC day 2 (t-test; t(13) = 2.78, p = 0.02). AUC day 3 (t-test; t(13) = 2.18, p = 0.048). f Cue-mediated Ca2+ activity during fear recall in the training context. Right: AUC day 4 (t-test; t(13) = 2.21, p = 0.046).

