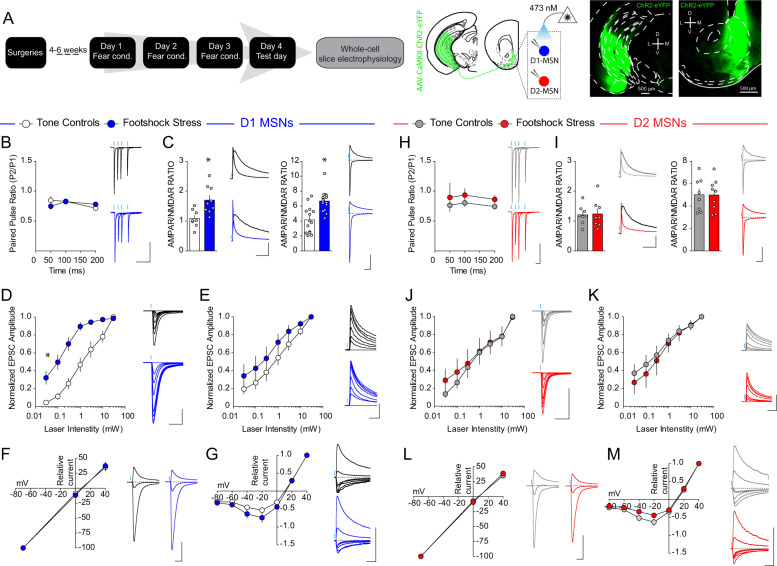
Fig. 3. VH synapses onto D1-, but not D2-, MSNs are potentiated with footshock stress.
a Experimental timeline. Representative image of ChR2-eYFP expression in the VH (left) and NAc (right) of D1-tdtomato mice. b, h Paired pulse ratio is unaffected by conditioned fear in D1-MSNs (n = 8 per group; two-way ANOVA; treatment main effect; F(2, 18) = 0.06, p = 0.9388; ISI main effect; F(2, 36) = 3.44, p < 0.043; treatment × intensity interaction; F(4, 36) = 2.21, p = 0.087) and D2-MSNs (n = 6 controls; n = 9 footshock stress; two-way ANOVA; treatment main effect; F(2, 18) = 0.37, p = 0.6983; ISI main effect; F(2, 36) = 0.53, p = 0.5917; treatment × intensity interaction; F(4, 36) = 0.07, p = 0.9912). c, i Biophysically-isolated AMPA-R/NMDAR in D1-MSNs (left; blue) and D2-MSNs (right; red) in mice in the tone (white), and footshock (light color) groups. D1-MSNs (n = 14–15 cells per group; t-test; t(27) = 4.26, p = 0.0002). D2-MSNs (n = 8–9 per group; t-test; t(15) = 0.03, p = 0.98). Pharmacologically isolated AMPA-R/NMDAR in D1-MSNs and D2-MSNs. D1-MSNs (n = 8–9 per group; t-test; t(15) = 3.24, p = 0.0055). D2-MSNs (n = 8 per group; t-test; t(14) = 0.15, p = 0.88). d, j Increased VH AMPAR oEPSCs in D1-MSNs from mice in the footshock group relative to the tone group (n = 7–9 per group; two-way ANOVA; treatment × intensity; F(6, 84) = 8.2, p < 0.0001). VH AMPAR oEPSC input curves in D2-MSNs are not significantly different between tone and footshock groups (n = 6–8 per group; two-way ANOVA; treatment main effect; F(1, 12) = 0.12, p = 0.73; Intensity main effect; F(6, 72) = 34.26, p < 0.0001; Treatment × intensity interaction; F(6,72) = 0.44, p = 0.85). e, k No difference in VH NMDAR oEPSCs in D1-MSNs (n = 7–8 per group; two-way ANOVA; treatment main effect; F(1, 13) = 1.48, p = 0.2449; intensity main effect; F(6, 78) = 63.61, p < 0.0001; treatment × intensity interaction; F(6,78) = 0.79, p = 0.5811), and D2-MSNs between footshock and tone groups (n = 5–9 per group; two-way ANOVA; treatment main effect; F(2, 19) = 0.25, p = 0.7798; intensity main effect; F(6, 114) = 68.1, p < 0.0001; treatment × intensity interaction; F(12, 114) = 0.24, p = 0.9957). f, l Current–voltage curves of VH AMPAR oEPSCs. D1-MSNs (n = 8–11 per group; Two-way ANOVA; treatment main effect; F(1, 17) = 0.002, p = 0.96; voltage main effect; F(2, 34) = 566.99, p < 0.0001; treatment × voltage interaction; F(2, 34) = 0.2, p = 0.82). D2-MSNs (n = 8–10 per group; two-way ANOVA; treatment main effect; F(1, 16) = 0.15, p = 0.70; voltage main effect; F(2, 32) = 1241.32, p < 0.0001; treatment × voltage interaction; F(2, 32) = 0.56, p = 0.58). g, m Current–voltage curves of VH NMDAR oEPSCs. D1-MSNs (n = 10 per group; two-way ANOVA; treatment main effect; F(1, 18) = 2.14, p = 0.16; voltage main effect; F(6,108) = 244.69, p < 0.0001; treatment × voltage interaction; F(6,108) = 1.36, p = 0.24). D2-MSNs (n = 8–10 per group; two-way ANOVA; treatment × voltage interaction; F(6,96) = 2.37, p = 0.035).

