
Figure 1. Vibration Promotes Sleep in Flies.
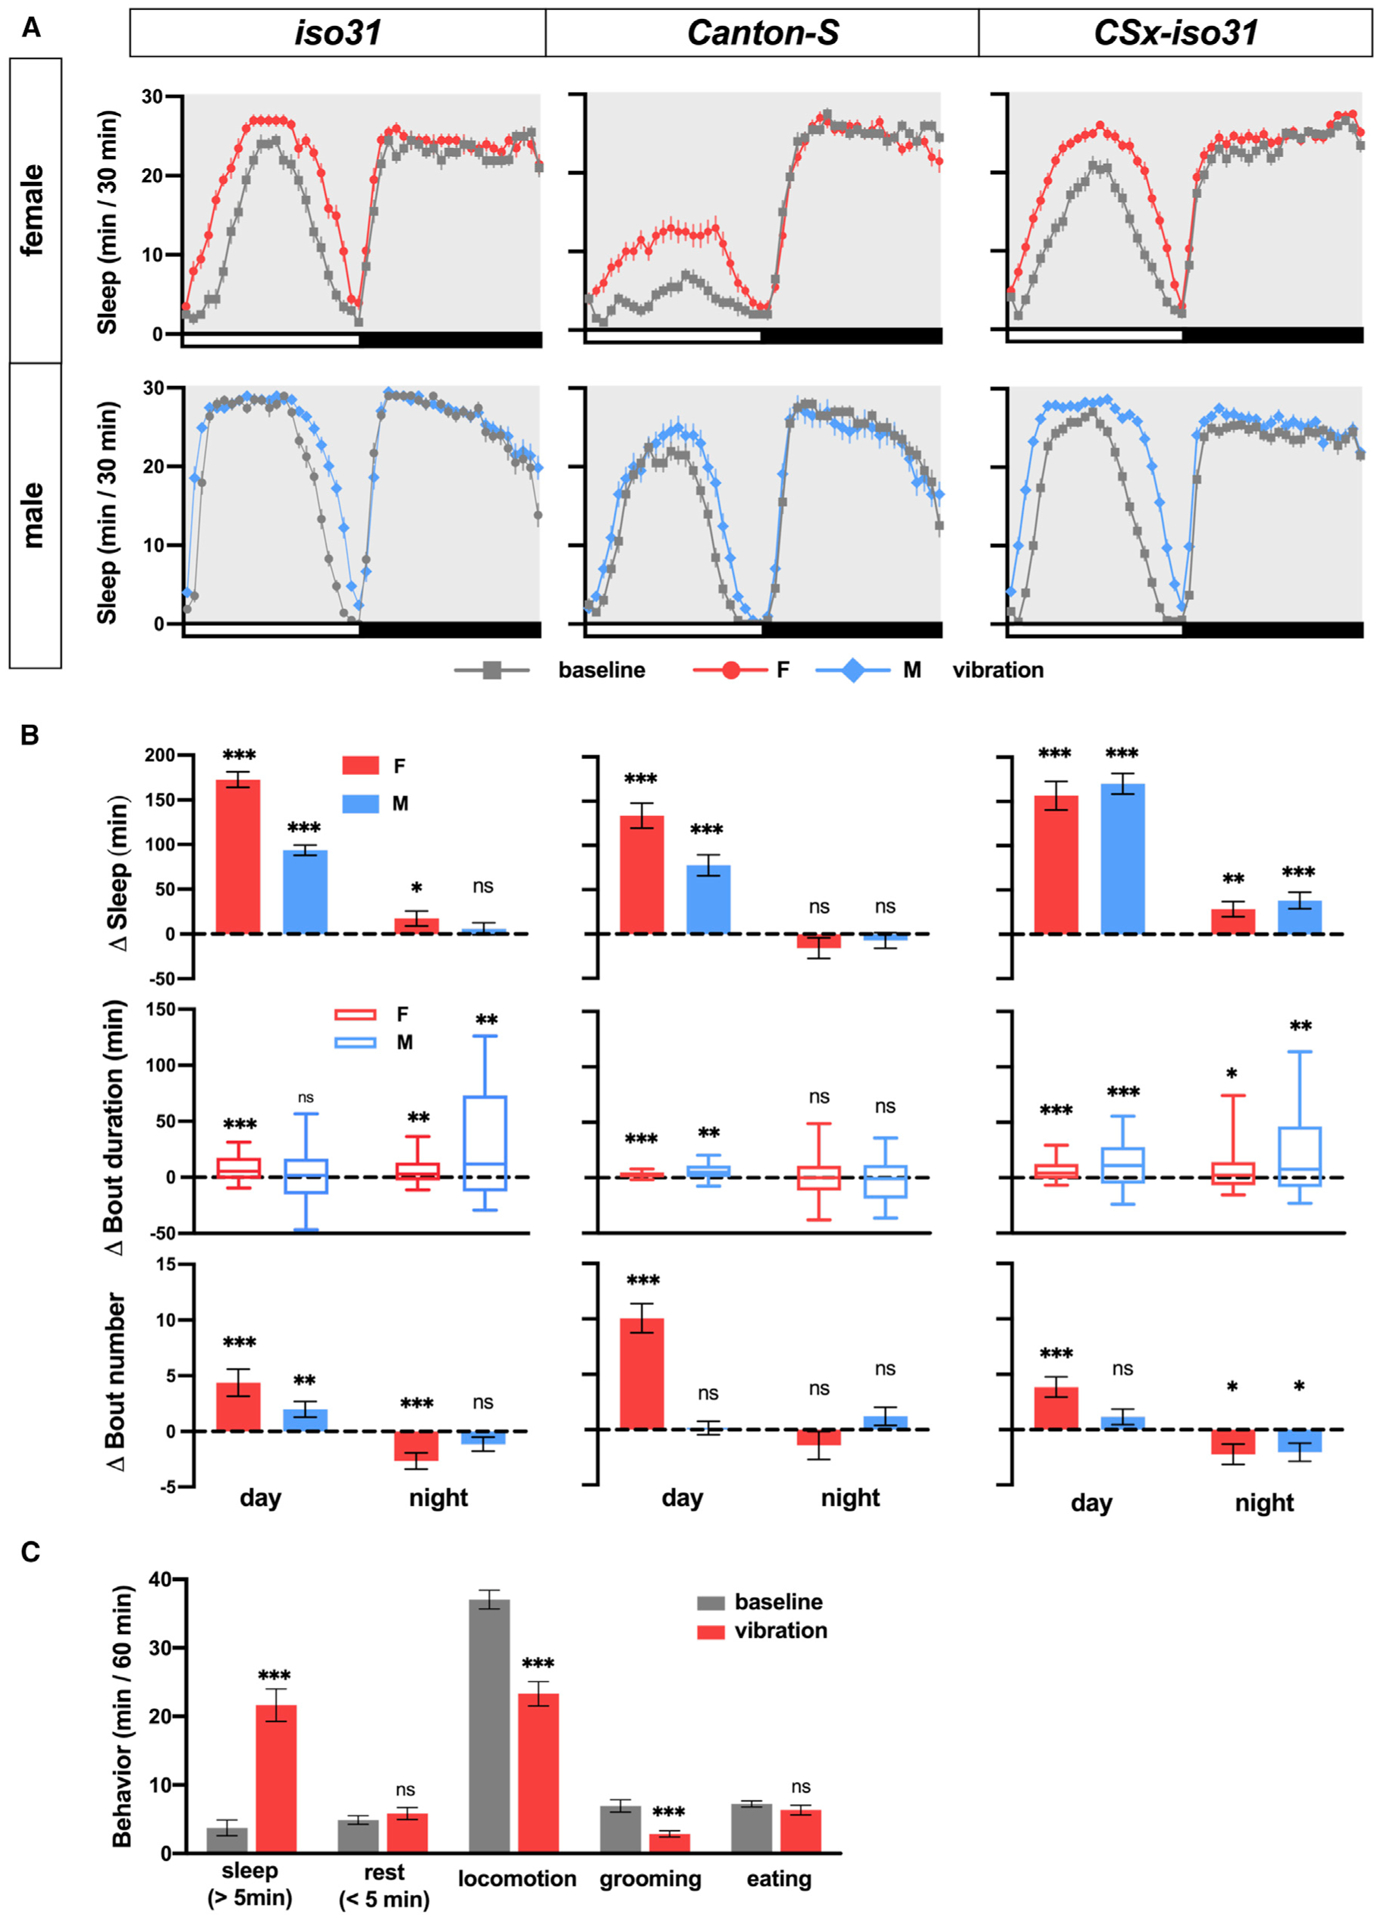
(A) Sleep profiles of iso31, CS, and CSx-iso31 females and males exposed to vibration for 24 h starting at Zeitgeber time (ZT) 0. Sleep was assayed using single-beam DAM monitors; n = 61–95.
(B) Daytime and nighttime changes (vibration day versus baseline day) in sleep amount, sleep bout length, and sleep bouts of flies shown in (A).
(C) Video analysis of iso31 females. Behavior was manually scored, and time spent engaged in each behavior during the first hour of vibration starting at ZT 1 (vibration) or the corresponding hour on the previous day (baseline) is shown; n = 32. For bout duration, the line inside the box indicates the median, and the whiskers indicate 10% and 90% percentiles.
In this and subsequent figures, error bars indicate SEMs; ns, not significant, *p < 0.05, **p < 0.01, and ***p < 0.001. Paired Student’s t test (Δ sleep and Δ bout number) or Wilcoxon matched-pairs signed rank test (Δ bout duration) with Bonferroni correction (B); 1-way repeated-measures ANOVA followed by multiple pairwise comparisons with Bonferroni correction (C).
See also Figure S1.