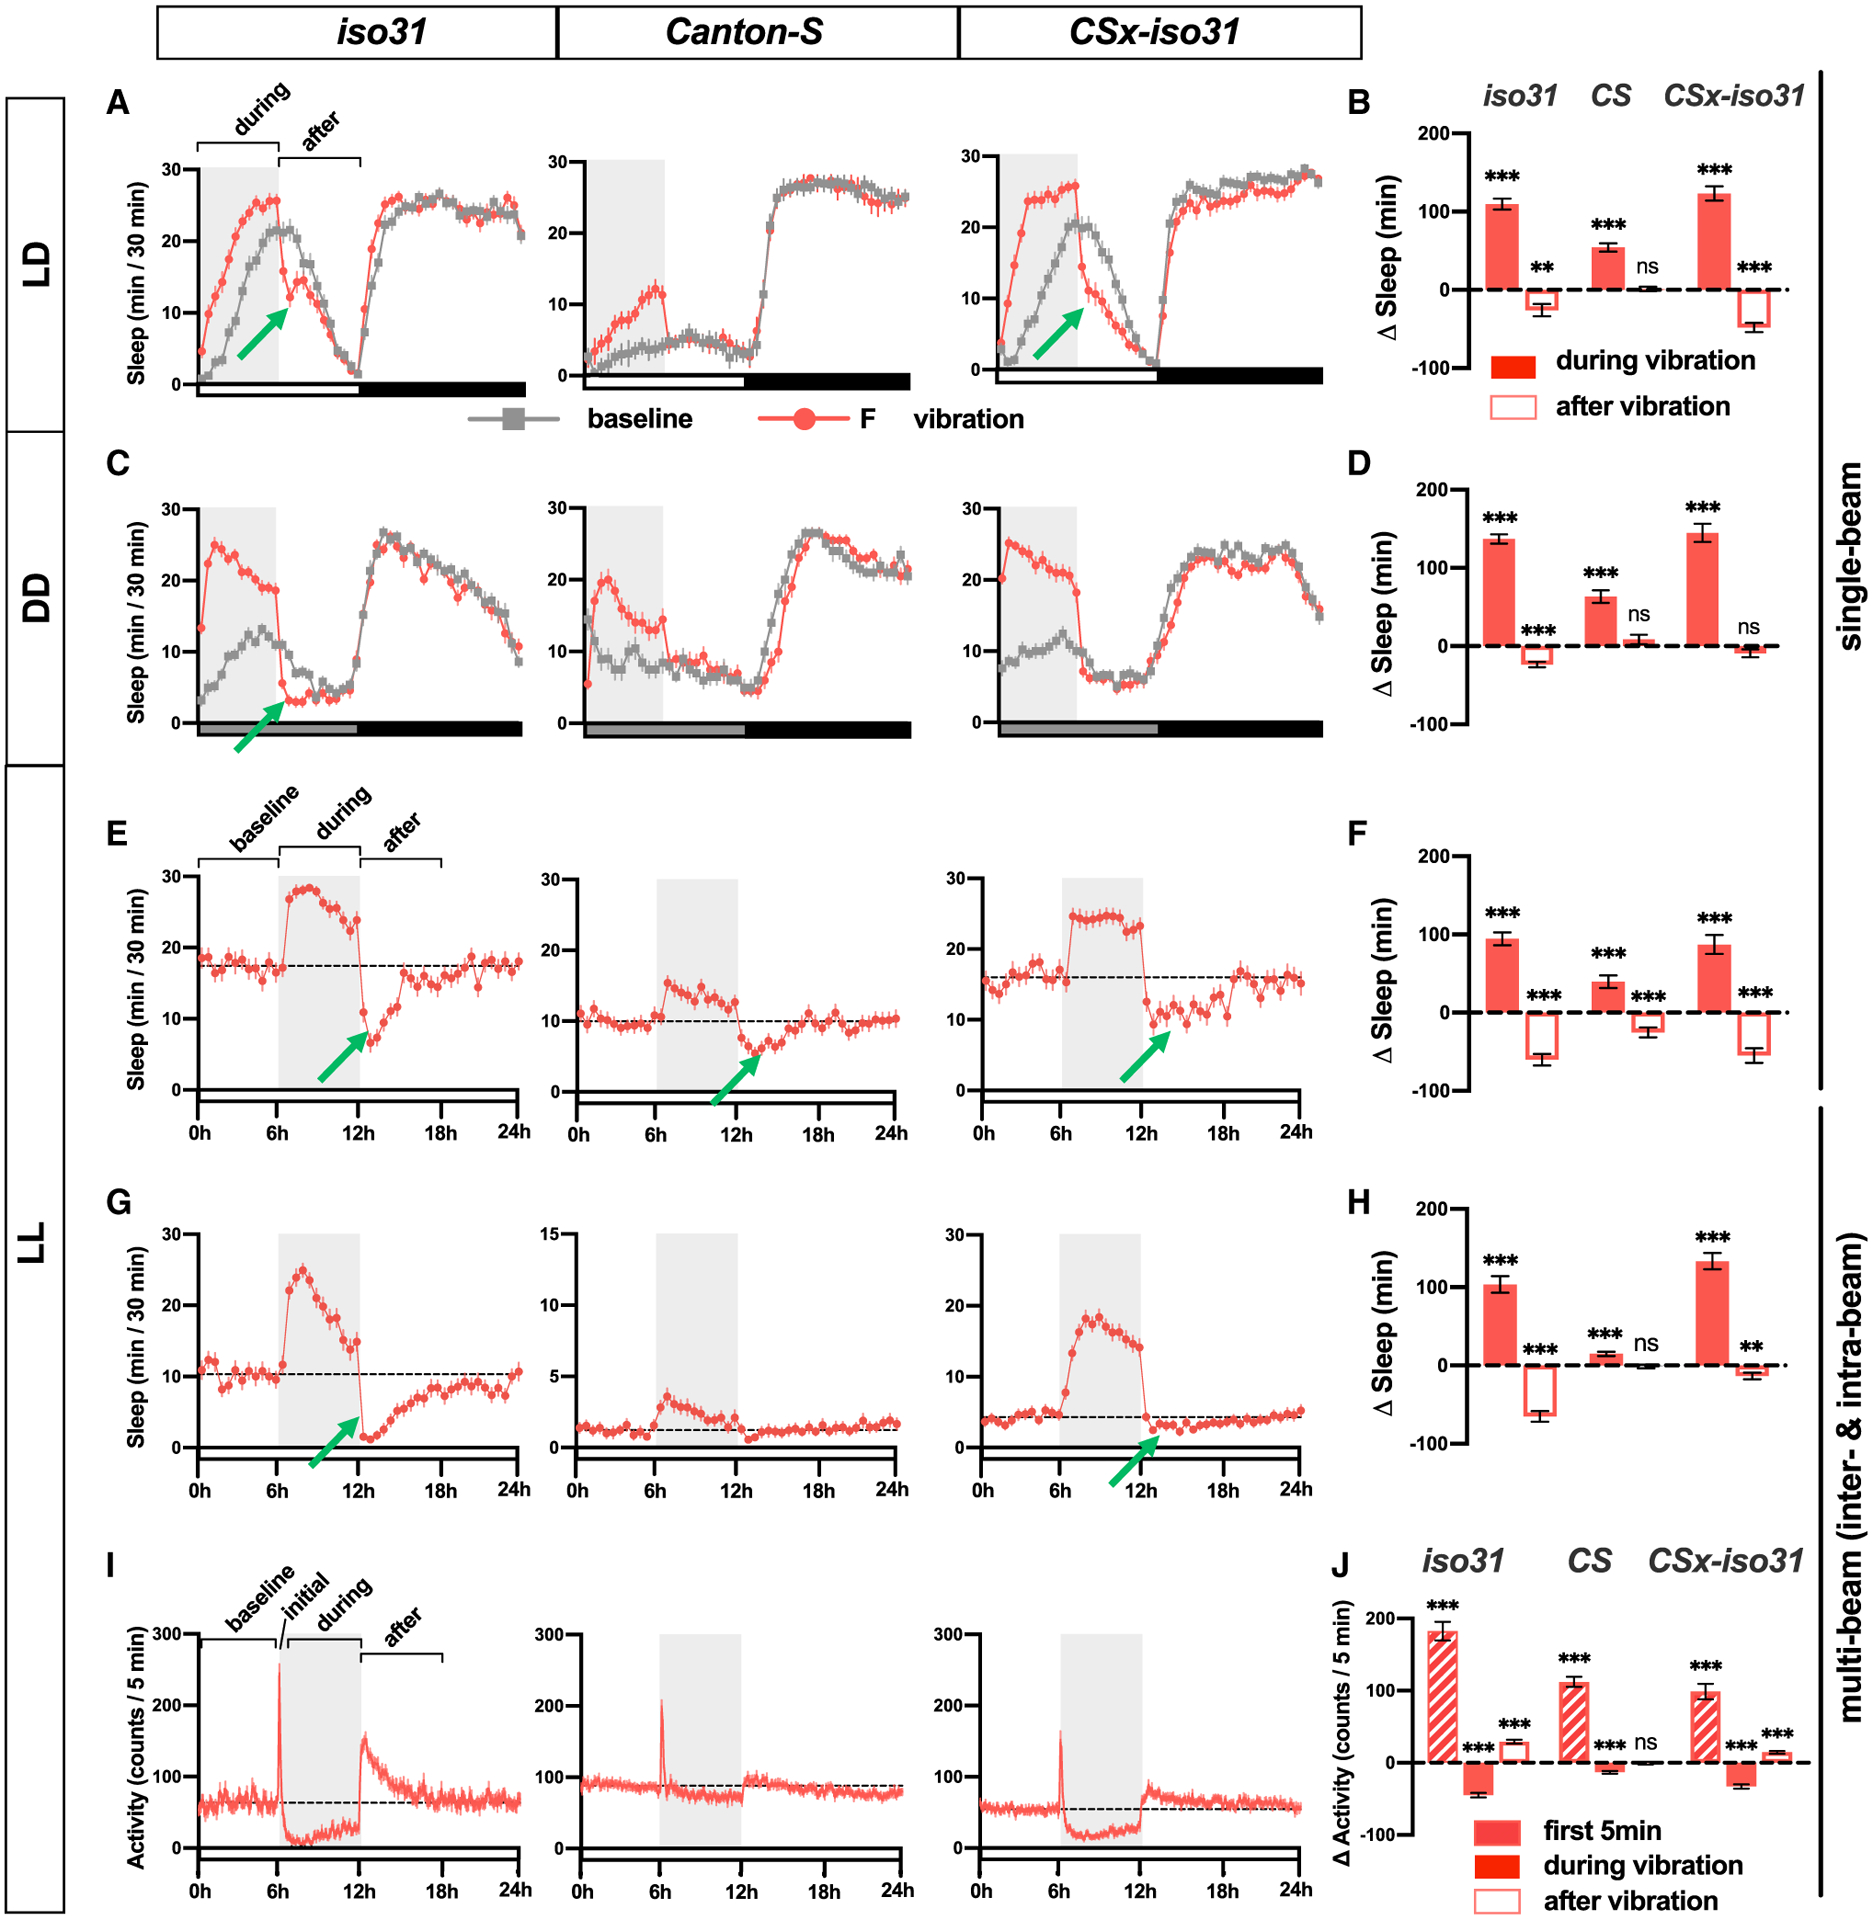
Figure 3. VIS Results in the Accrual of Sleep Credit and Does Not Require Light and the Circadian Clock.

(A, C, E, and G) Sleep profiles of iso31, CS, and CSx-iso31 females in LD (A), DD (C), and LL (E and G), exposed to vibration for 6 h starting at ZT 0 or circadian time (CT) 0. Single-beam monitors were used in (A), (C), and (E), whereas multi-beam monitors were used in (G); n = 46–92. The gray box indicates the 6-h period of vibration. Green arrows point to negative rebound.
(B, D, F, and H) Sleep change during or after 6 h vibration relative to a 6-h baseline period of flies shown in (A), (C), (E), and (G), respectively.
(I) Activity profile of flies shown in (G). Both inter-beam and intra-beam movements in multi-beam monitors are included.
(J) Changes in activity count for 6 h before vibration (baseline), first 5 min (initial) or 0.5–6 h (during) of vibration, and 6 h after vibration (after).
Paired Student’s t test with Bonferroni correction (B, D, F, and H), repeated-measures ANOVA followed by Dunnett’s post hoc test relative to baseline (J). See also Figure S2.
