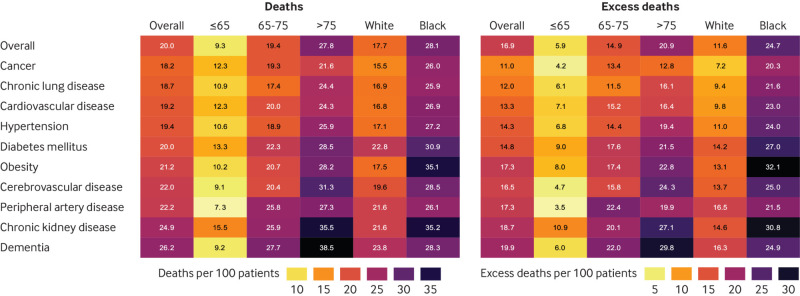
Fig 3.
Rates of death in patients admitted to hospital with coronavirus disease 2019 (covid-19) (left), and excess deaths compared with patients admitted with seasonal influenza (right), by age (≤65, 65-75, >75 years), race (white, black), and comorbid condition. Number in each cell represents rate of death or excess deaths per 100 patients admitted with covid-19, given conditions. Lighter colored cells indicate lower death rates or smaller differences, and darker colored cells indicate higher death rates or larger differences

