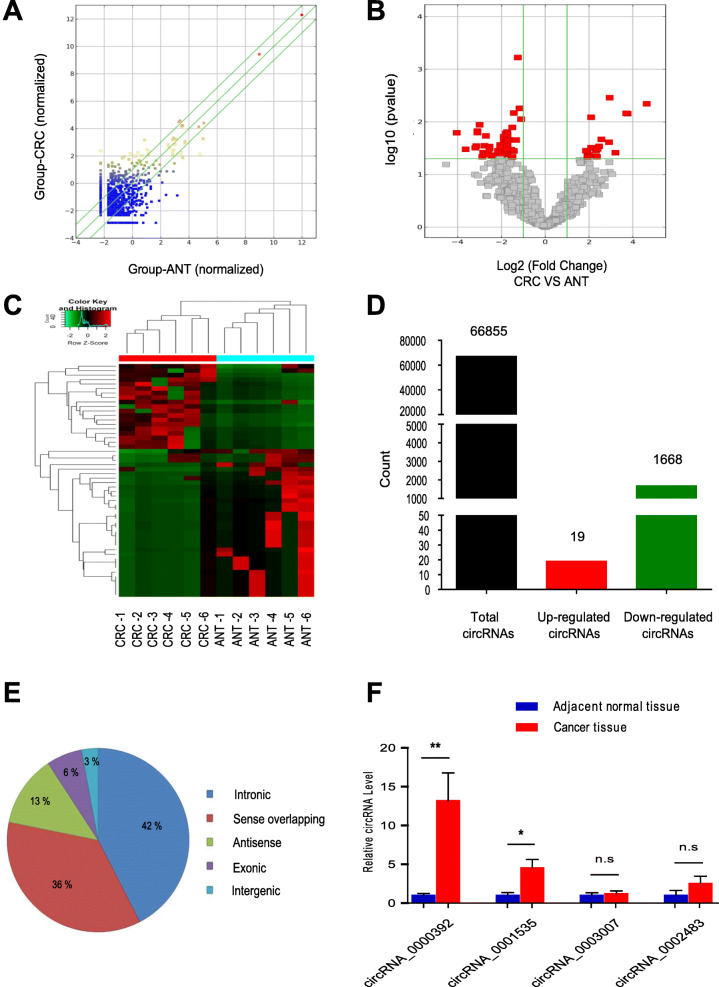
Fig. 1.
Identification of circular RNAs by RNA-seq analyses in human CRC samples. a The scatter plot shows the changes in circRNA expression in six paired CRC and adjacent normal tissues (ANT). CircRNAs above the top green line and below the bottom green line demonstrated a greater than 1.5-fold change between the two compared groups. b The volcano plot shows the expression profiling of circRNA between CRC and ANT. The vertical green lines refer to a 2.0-fold (log2 scaled) upregulation and downregulation, respectively. The horizontal green line corresponds to a P-value of 0.05 (−log10 scaled). The red points in the plot represent differentially expressed circRNAs with statistical significance. c Clustered heat map indicating differences in circRNA expression profiling between CRC and ANT tissues. d The number of total circRNAs identified by RNA-seq and the number of differentially expressed circRNAs. e CircRNAs were classified by categories. f Validation of the top 4 differentially expressed circRNAs in 16 paired CRC and ANT tissues by RT-qPCR. CRC, colorectal cancer; ANT, adjacent normal tissue. Data represent the mean ± SD. * P < 0.05, ** P < 0.01

