
Fig. 6.
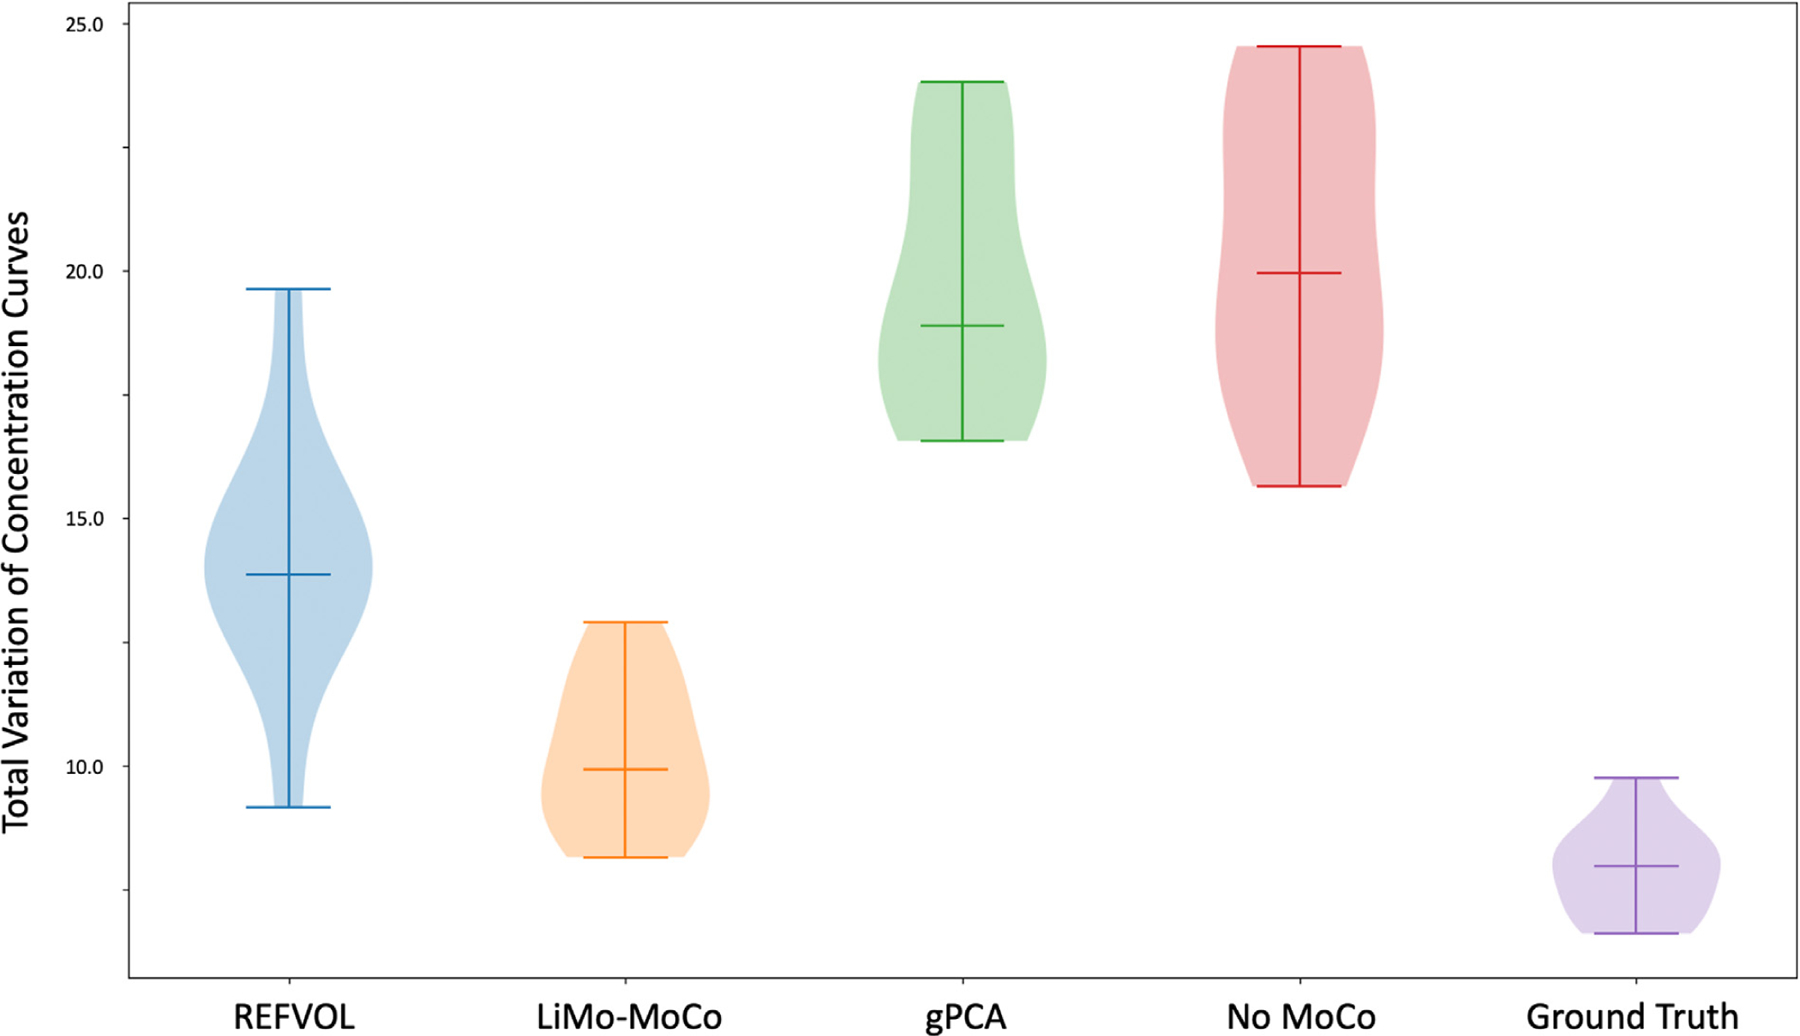
Total Variation metric applied to the concentration curves after registration of the synthetic data experiments. The metric computes the difference in absolute value between the concentration curves before and after applying Gaussian smoothing. LiMo-MoCo presented the smallest variability of all registration methods, indicating that it reduced the discontinuities created by motion.