
Fig. 7.
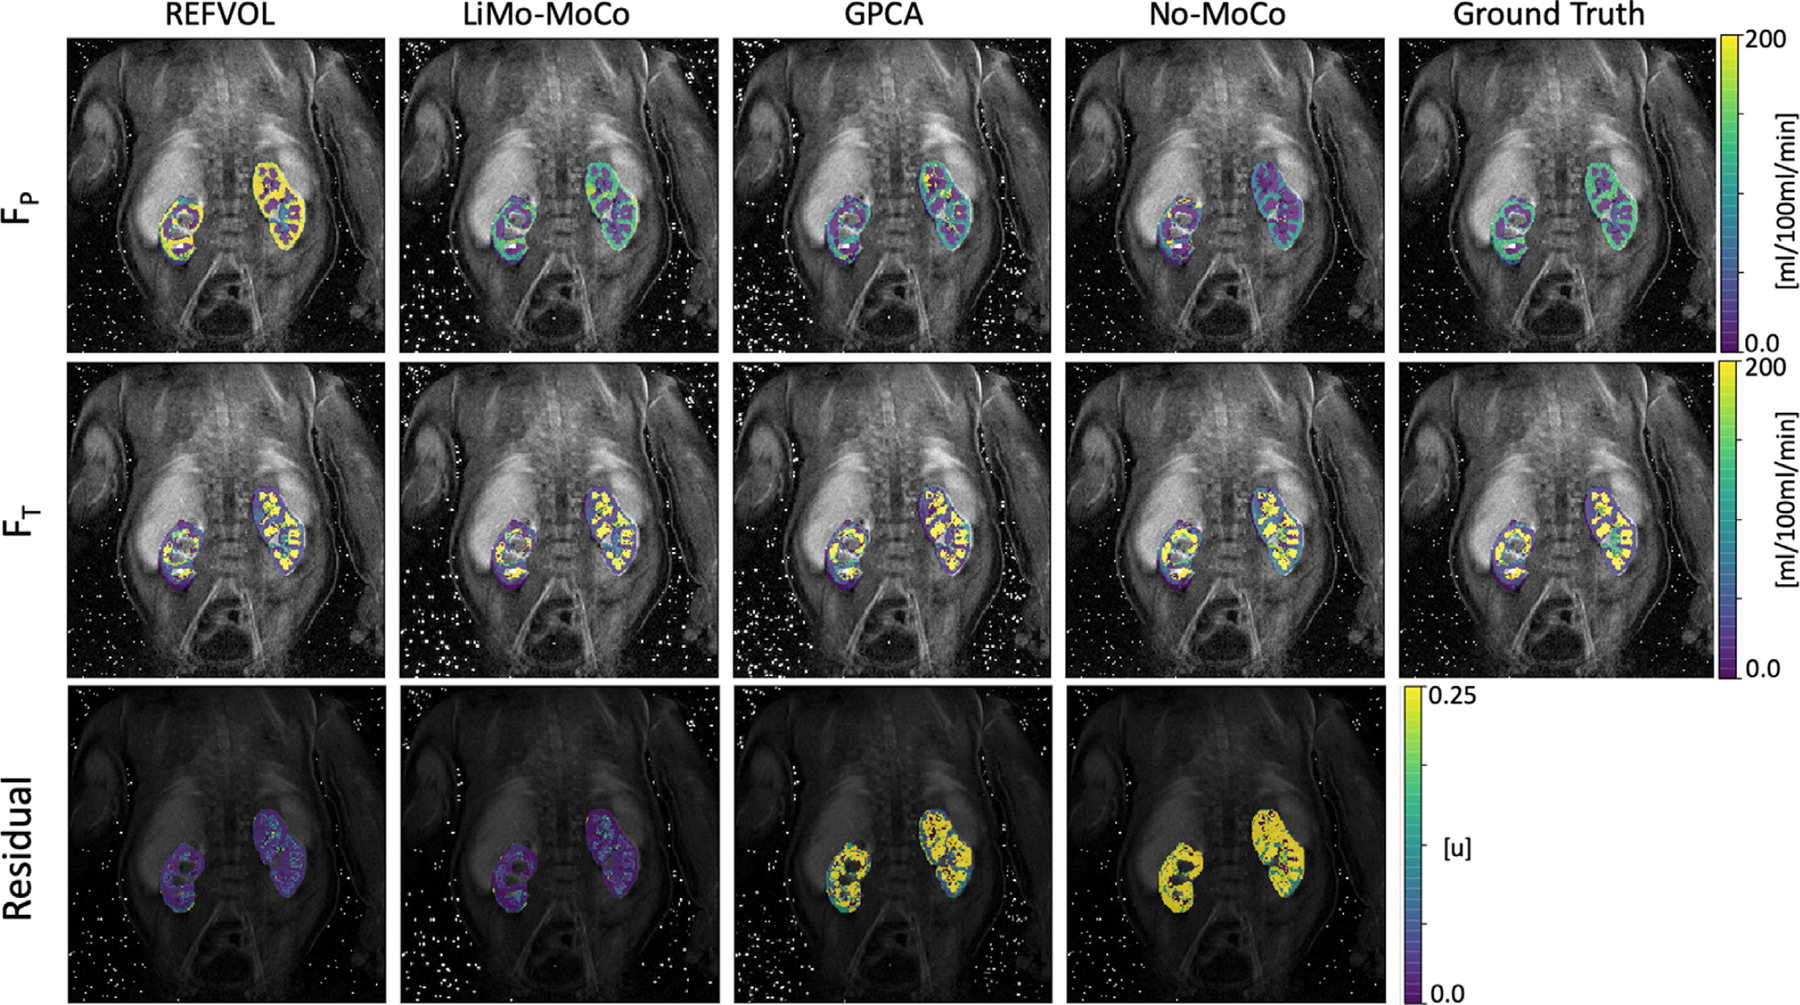
Parameter maps obtained after fitting the tracer kinetic model to the registered data and ground truth in one repetition of the synthetic experiment. The maps show the perfusion FP, the tubular flow FT and the nRMSE of the model fit (i.e. the goodness of fit). The parameter maps obtained with LiMo-MoCo present the highest similarity with the ground truth (average error in FT = 66 ± 125 and FP = 48 ± 62). Moreover, the residual error achieved with the proposed LiMo-MoCo was the smallest compared to other competing methods (0.94 ± 4.86).