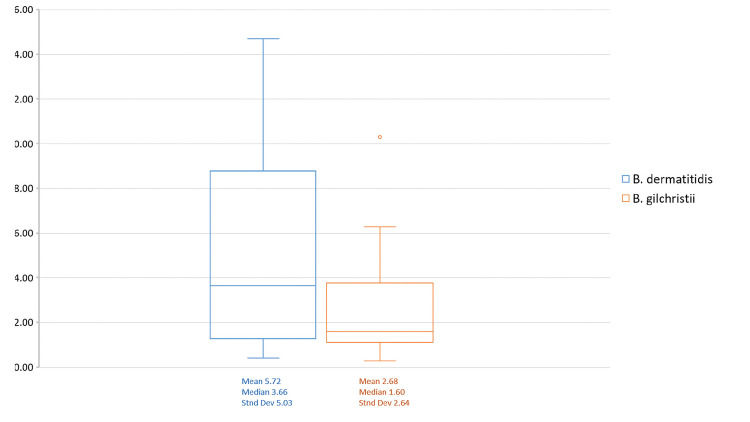
Figure 1.
Urine antigen EIA concentration (ng/mL, ≤ 7 days of diagnosis) by B. gilchristii and B. dermatitidis infections compared using the one-factor ANOVA test for independent measures. The interquartile range box represents the middle 50% of date with the line inside the box representing the median. Upper and lower whiskers extend from the minimum to maximum data point with outlier data indicated as a dot beyond the whisker.

